SOM cluster: 1035
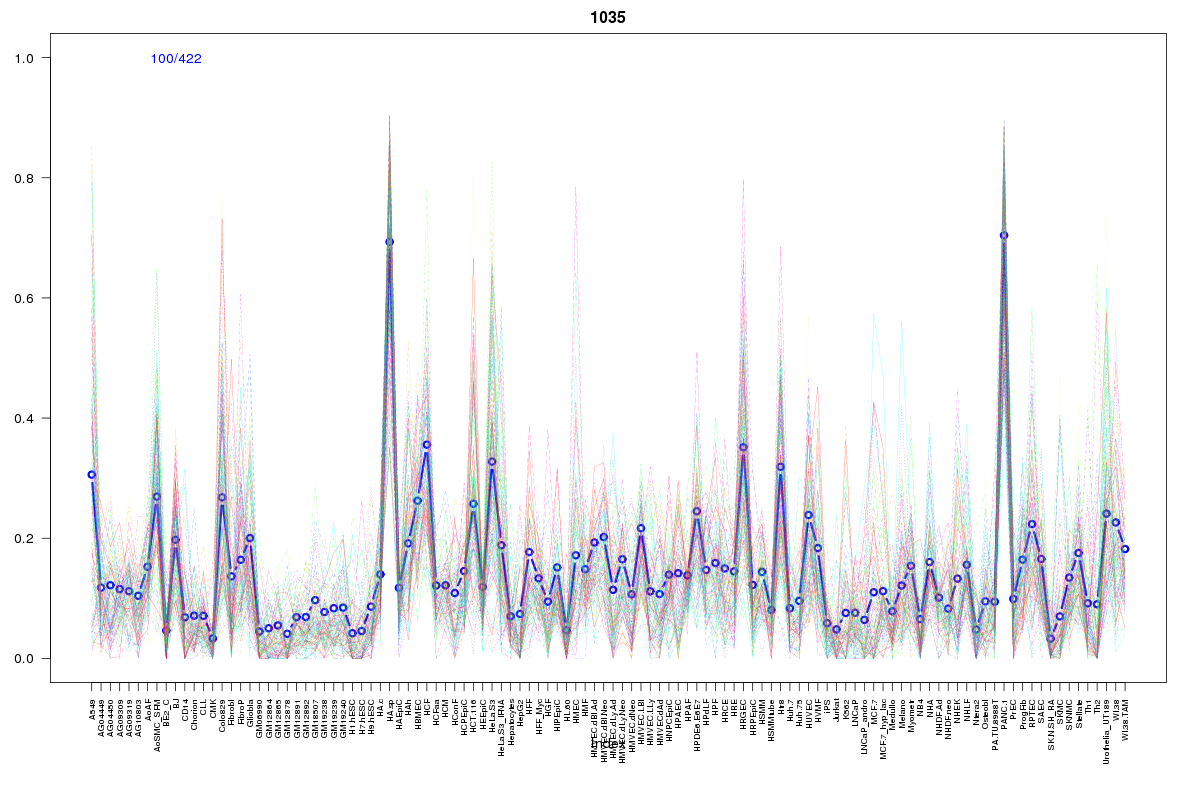
Cluster Hypersensitivity Profile

Genomic Location Trend
These plots show the distribution of the DHS sites surrounding the Transcript Start Site of the nearest gene.
Stats
Number of sites: 422Promoter: 7%
CpG-Island: 0%
Conserved: 34%
Enriched Motifs & Matches
Match Detail: [Jaspar]
|
| ||
|---|---|---|
| Sites: 53/100 | e-val: 1.7e-28 | ||
| Factor | e-val(match) | DB |
| Foxd3 | 0.000099492 | JASPAR |
| Lhx3 | 0.00095003 | JASPAR |
| Foxq1 | 0.0030846 | JASPAR |
| Pax4 | 0.0037928 | JASPAR |
| HNF1A | 0.010277 | JASPAR |
BED file downloads
Top 10 Example Regions
| Location | Gene Link | Dist. |
|---|---|---|
| chr10: 24752965-24753115 | KIAA1217 | 34.61 |
| chrX: 106138000-106138150 | MORC4 | 47.73 |
| chr3: 149104180-149104330 | RP11-278L15.4 | 50.01 |
| chr8: 131456385-131456535 | ASAP1 | 53.05 |
| chr2: 54799265-54799415 | AC093110.3 | 59.5 |
| chr5: 76086020-76086170 | snoU13 | 68.4 |
| chr5: 76086020-76086170 | F2RL1 | 68.4 |
| chr5: 76086020-76086170 | F2R | 68.4 |
| chr5: 138090165-138090315 | CTNNA1 | 70.21 |
| chr18: 20558240-20558390 | RBBP8 | 70.29 |