SOM cluster: 1037
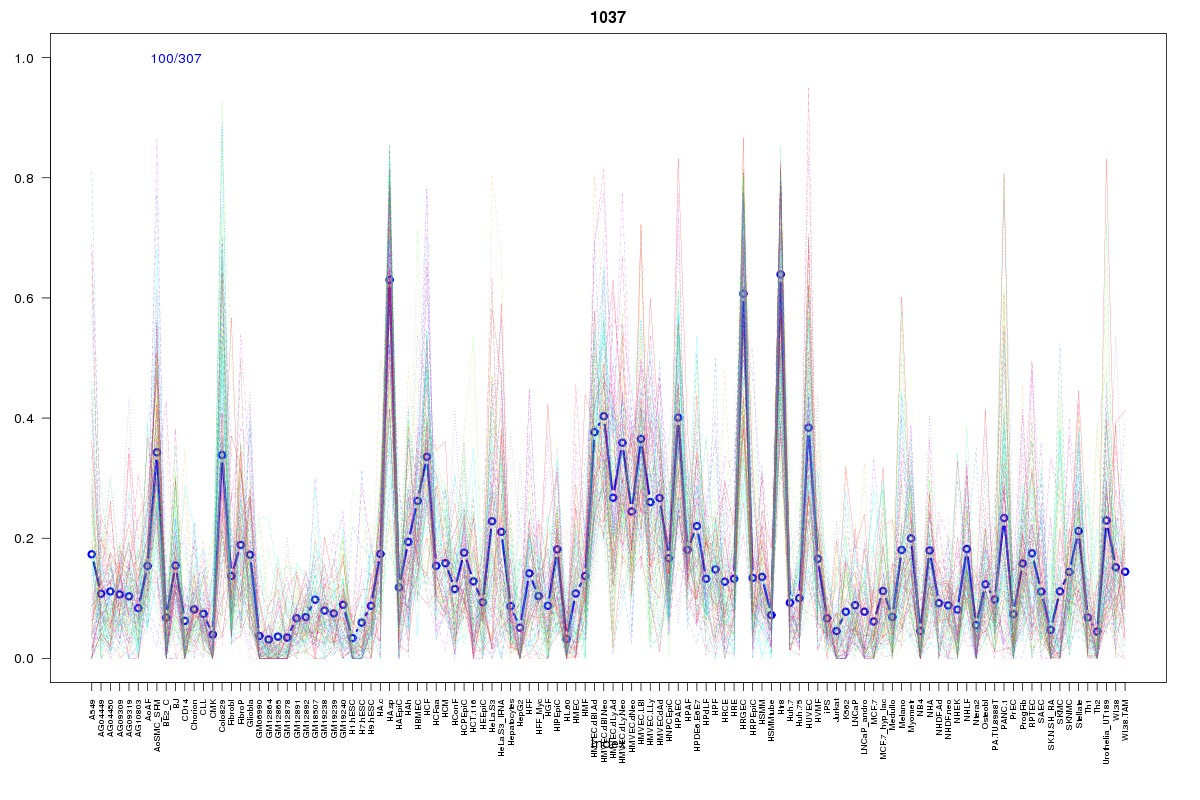
Cluster Hypersensitivity Profile

Genomic Location Trend
These plots show the distribution of the DHS sites surrounding the Transcript Start Site of the nearest gene.
Stats
Number of sites: 307Promoter: 13%
CpG-Island: 0%
Conserved: 40%
Enriched Motifs & Matches
Match Detail: [Jaspar]
|
| ||
|---|---|---|
| Sites: 30/100 | e-val: 0.000000000074 | ||
| Factor | e-val(match) | DB |
| MEF2A | 0.00033884 | JASPAR |
| HNF1A | 0.00078639 | JASPAR |
| HNF1B | 0.0025764 | JASPAR |
| Foxd3 | 0.018543 | JASPAR |
| Pou5f1 | 0.022307 | JASPAR |
BED file downloads
Top 10 Example Regions
| Location | Gene Link | Dist. |
|---|---|---|
| chr1: 145542420-145542570 | PEX11B | 19.05 |
| chr1: 145542420-145542570 | LIX1L | 19.05 |
| chr1: 145542420-145542570 | NUDT17 | 19.05 |
| chr4: 74983120-74983270 | CXCL2 | 35.7 |
| chr4: 74983120-74983270 | CXCL3 | 35.7 |
| chr8: 10009560-10009710 | MSRA | 46.25 |
| chr1: 90102080-90102230 | RP11-413E1.4 | 47.5 |
| chr1: 90102080-90102230 | RP5-1007M22.2 | 47.5 |
| chr1: 90102080-90102230 | LRRC8C | 47.5 |
| chr5: 66254020-66254170 | MAST4 | 48.88 |