SOM cluster: 1046
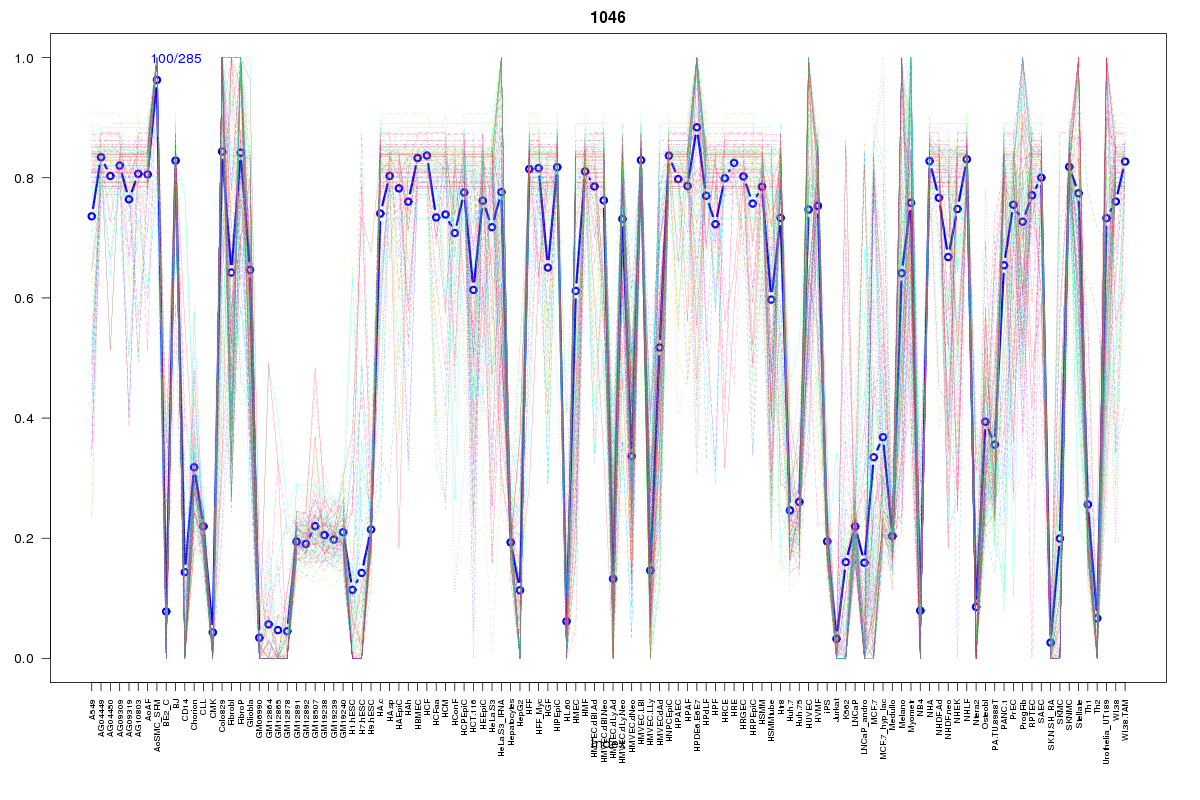
Cluster Hypersensitivity Profile

Genomic Location Trend
These plots show the distribution of the DHS sites surrounding the Transcript Start Site of the nearest gene.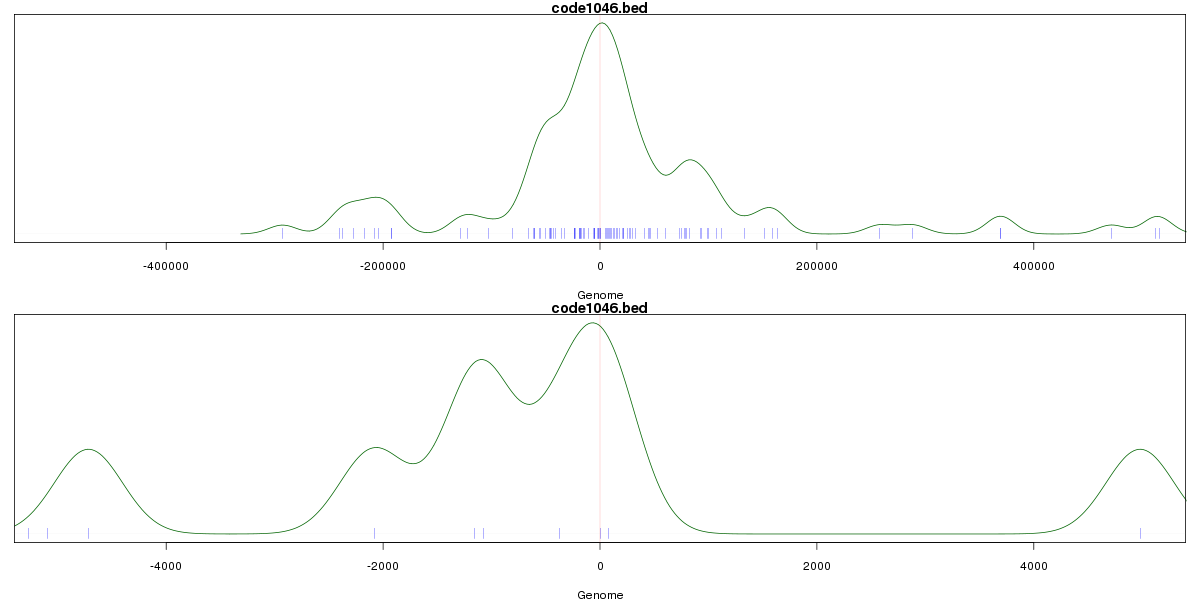
Stats
Number of sites: 285Promoter: 4%
CpG-Island: 0%
Conserved: 53%
Enriched Motifs & Matches
Match Detail: [Jaspar]
|
| ||
|---|---|---|
| Sites: 73/100 | e-val: 0 | ||
| Factor | e-val(match) | DB |
| NFE2L2 | 0.00000000076337 | JASPAR |
| AP1 | 0.0000000008537 | JASPAR |
| NFE2L1::MafG | 0.00019509 | JASPAR |
| Pax2 | 0.0051422 | JASPAR |
| PBX1 | 0.015274 | JASPAR |
BED file downloads
Top 10 Example Regions
| Location | Gene Link | Dist. |
|---|---|---|
| chr6: 25193920-25194070 | RP3-522P13.3 | 42.92 |
| chr1: 203661860-203662010 | SNORA77 | 44.42 |
| chr1: 203661860-203662010 | ATP2B4 | 44.42 |
| chr1: 203661860-203662010 | LAX1 | 44.42 |
| chr11: 85437060-85437210 | TMEM126A | 62.63 |
| chr11: 85437060-85437210 | CREBZF | 62.63 |
| chr11: 85437060-85437210 | DLG2 | 62.63 |
| chr12: 88636040-88636190 | TMTC3 | 62.96 |
| chr22: 30592080-30592230 | OSM | 64.45 |
| chr22: 30592080-30592230 | TBC1D10A | 64.45 |