SOM cluster: 1054
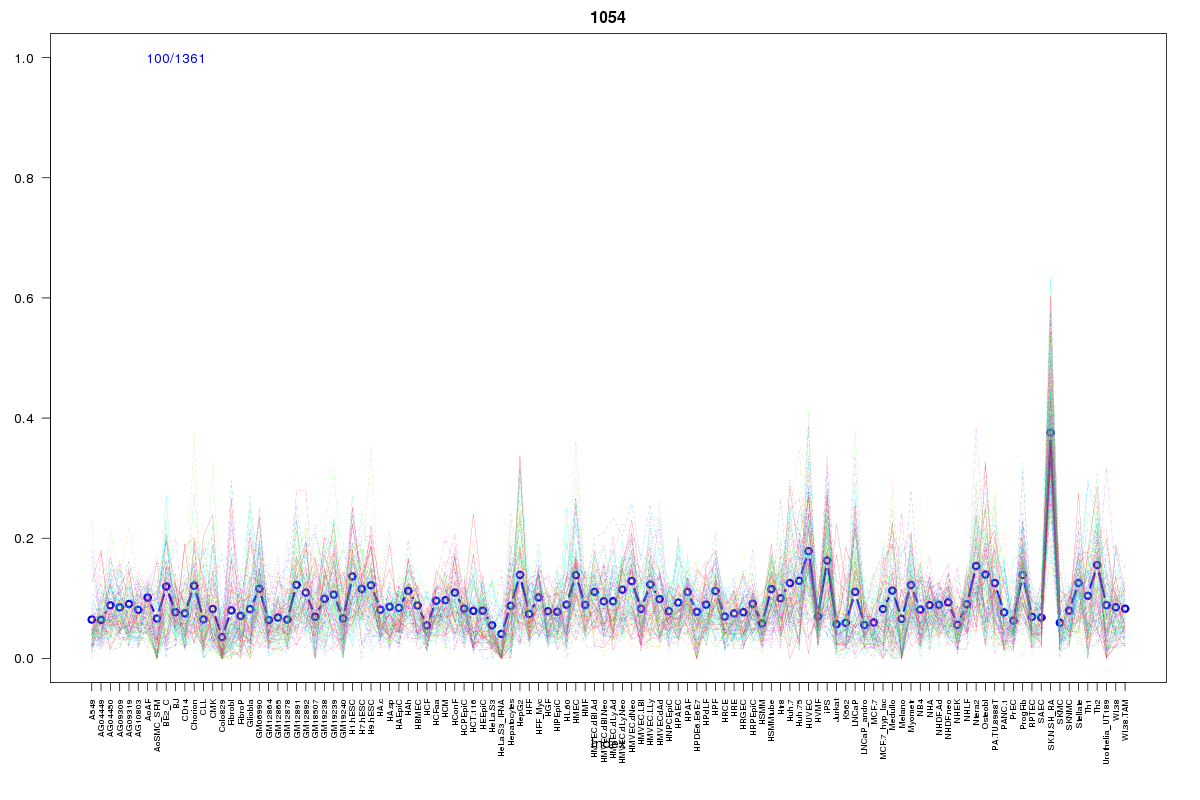
Cluster Hypersensitivity Profile

Genomic Location Trend
These plots show the distribution of the DHS sites surrounding the Transcript Start Site of the nearest gene.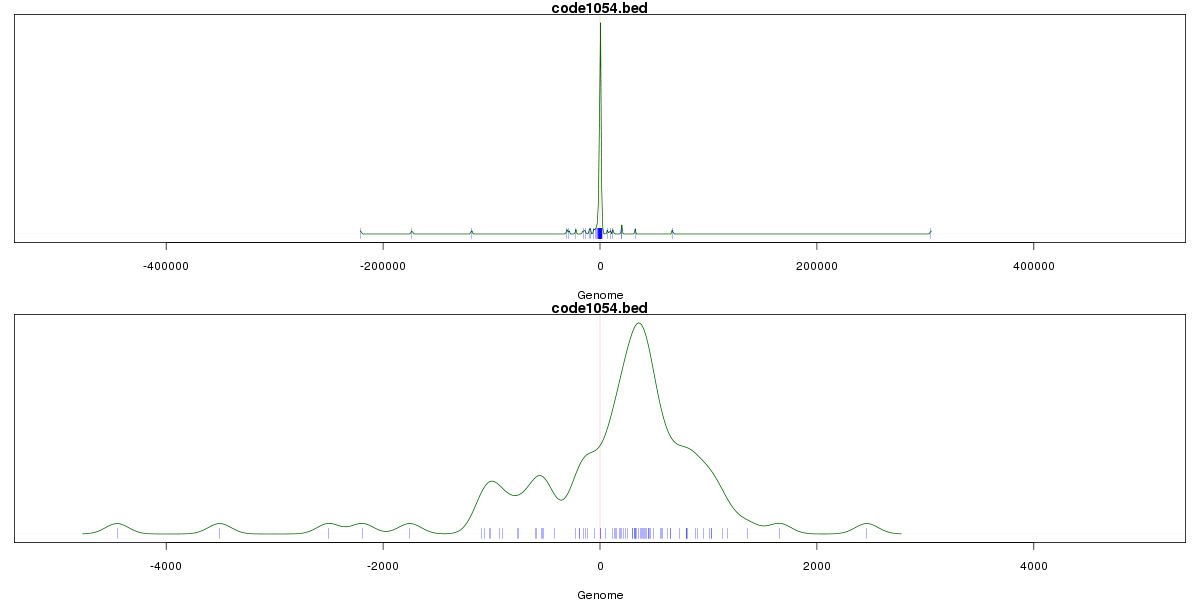
Stats
Number of sites: 1361Promoter: 27%
CpG-Island: 76%
Conserved: 58%
Enriched Motifs & Matches
Match Detail: [Jaspar]
|
| ||
|---|---|---|
| Sites: 81/100 | e-val: 0 | ||
| Factor | e-val(match) | DB |
| SP1 | 0.00000058961 | JASPAR |
| TFAP2A | 0.000019016 | JASPAR |
| PLAG1 | 0.0007544 | JASPAR |
| Klf4 | 0.0040274 | JASPAR |
| RXR::RAR_DR5 | 0.029596 | JASPAR |
|
| ||
| Sites: 70/100 | e-val: 0.0000000000036 | ||
| Factor | e-val(match) | DB |
| SP1 | 0.0000011538 | JASPAR |
| TFAP2A | 0.00087222 | JASPAR |
| Klf4 | 0.0045201 | JASPAR |
| NHLH1 | 0.0095428 | JASPAR |
| PLAG1 | 0.011154 | JASPAR |
BED file downloads
Top 10 Example Regions
| Location | Gene Link | Dist. |
|---|---|---|
| chr3: 37494185-37494335 | ITGA9 | 30.17 |
| chr9: 133320580-133320730 | snoU13 | 32.99 |
| chr9: 117266520-117266670 | ATP6V1G1 | 35.3 |
| chr10: 94834365-94834515 | CYP26A1 | 41.66 |
| chr2: 25265745-25265895 | EFR3B | 43.12 |
| chr4: 57397045-57397195 | THEGL | 43.22 |
| chr1: 2106385-2106535 | RP11-181G12.2 | 47.9 |
| chr1: 70033660-70033810 | LRRC7 | 48.93 |
| chrX: 134156680-134156830 | FAM127B | 49.56 |
| chr8: 41755225-41755375 | KAT6A | 49.9 |