SOM cluster: 1067
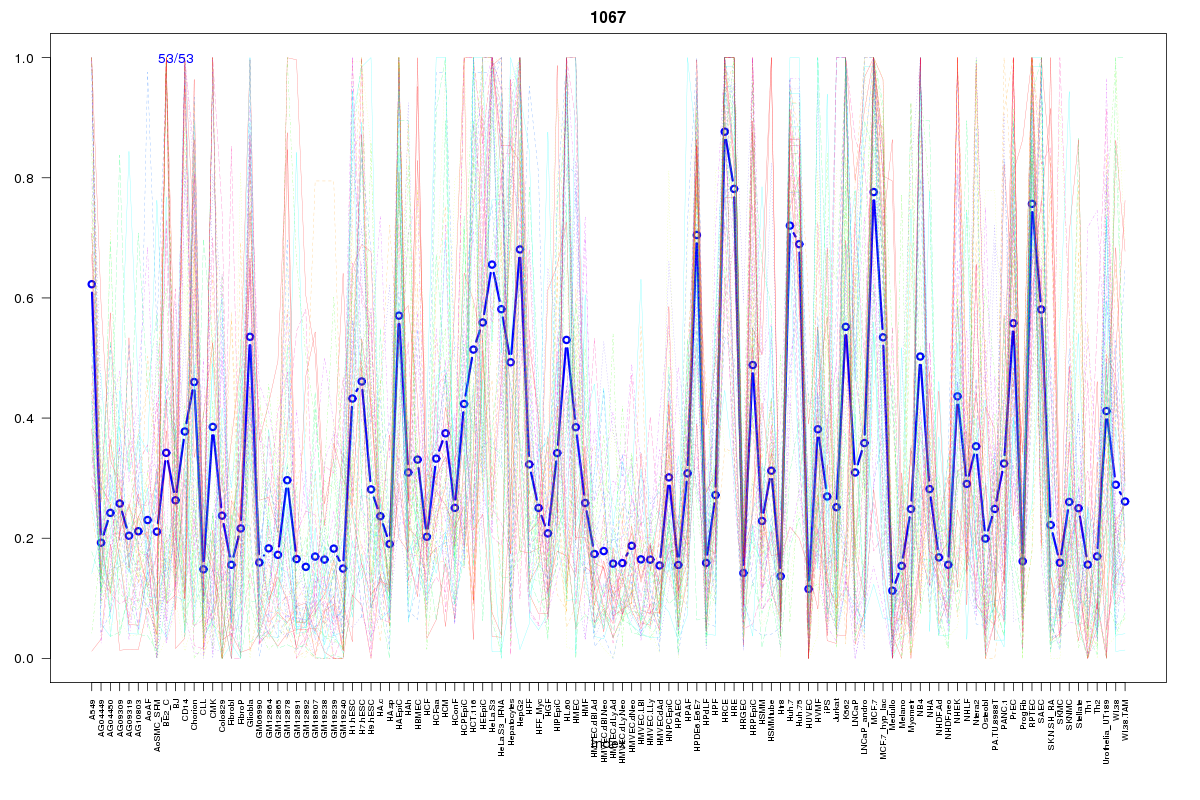
Cluster Hypersensitivity Profile

Genomic Location Trend
These plots show the distribution of the DHS sites surrounding the Transcript Start Site of the nearest gene.
Stats
Number of sites: 53Promoter: 17%
CpG-Island: 2%
Conserved: 25%
Enriched Motifs & Matches
Match Detail: [Jaspar]
|
| ||
|---|---|---|
| Sites: 35/53 | e-val: 8.2e-17 | ||
| Factor | e-val(match) | DB |
| Pax4 | 0.000000024791 | JASPAR |
| SP1 | 0.00000011613 | JASPAR |
| Klf4 | 0.00014267 | JASPAR |
| RREB1 | 0.0033338 | JASPAR |
| RXR::RAR_DR5 | 0.0039467 | JASPAR |
BED file downloads
Top 10 Example Regions
| Location | Gene Link | Dist. |
|---|---|---|
| chr11: 70864260-70864410 | SHANK2 | 57.01 |
| chr2: 220436760-220436910 | INHA | 71.25 |
| chr2: 220436760-220436910 | OBSL1 | 71.25 |
| chr2: 220436760-220436910 | TMEM198 | 71.25 |
| chr2: 220436760-220436910 | CHPF | 71.25 |
| chr1: 54482220-54482370 | LRRC42 | 71.48 |
| chr20: 48804120-48804270 | CEBPB | 72.18 |
| chr20: 48804120-48804270 | RP11-112L6.4 | 72.18 |
| chr3: 13526700-13526850 | HDAC11 | 73.41 |
| chr1: 200865920-200866070 | C1orf106 | 86.41 |