SOM cluster: 1068
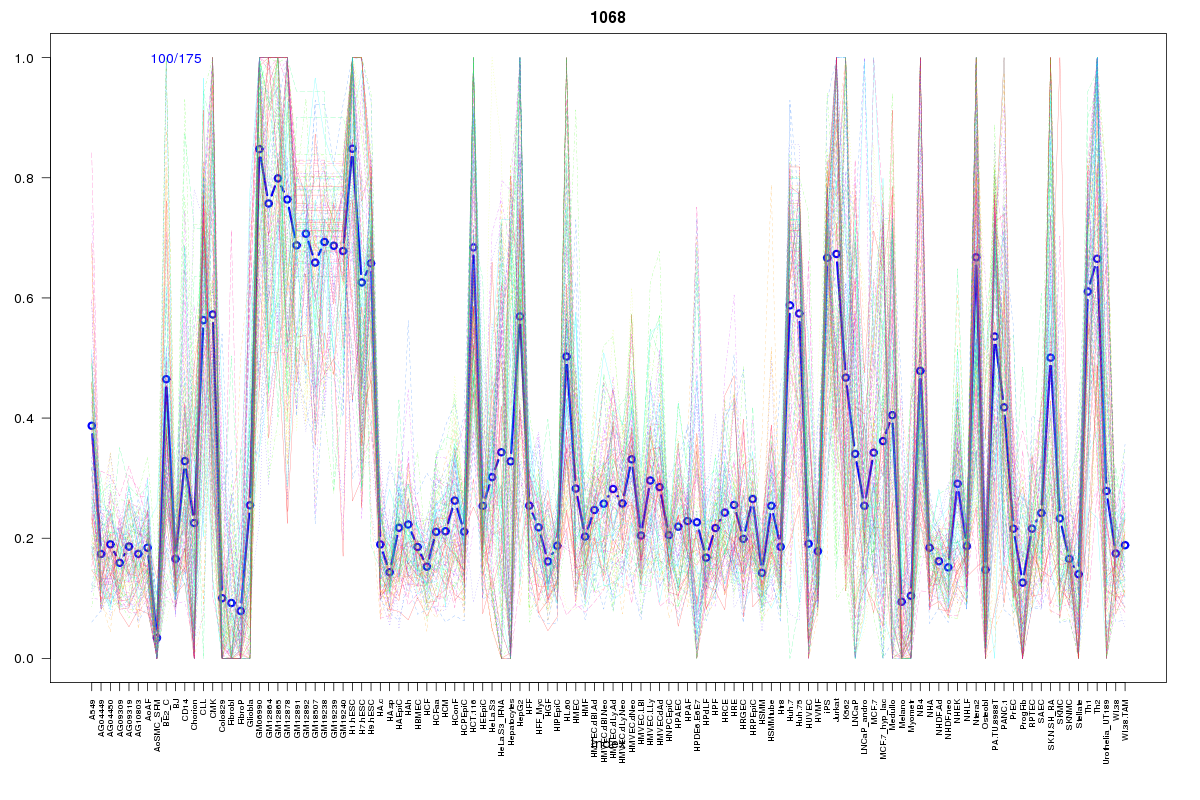
Cluster Hypersensitivity Profile

Genomic Location Trend
These plots show the distribution of the DHS sites surrounding the Transcript Start Site of the nearest gene.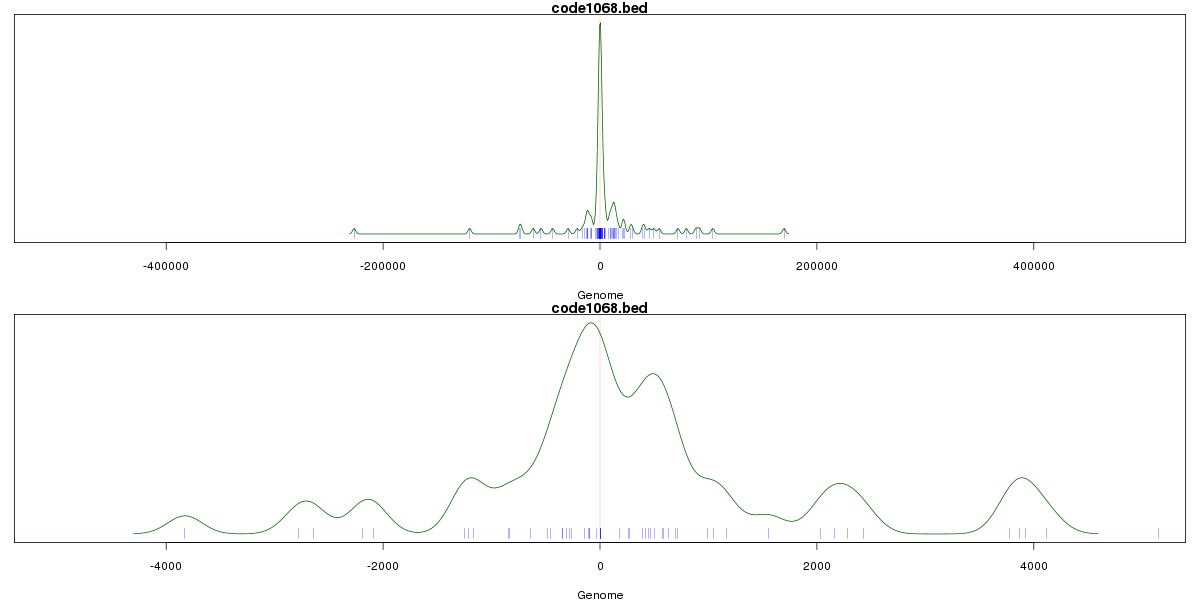
Stats
Number of sites: 175Promoter: 24%
CpG-Island: 29%
Conserved: 48%
Enriched Motifs & Matches
Match Detail: [Jaspar]
|
| ||
|---|---|---|
| Sites: 76/100 | e-val: 1.90016e-42 | ||
| Factor | e-val(match) | DB |
| CTCF | 0.0000000017885 | JASPAR |
| SP1 | 0.000000001947 | JASPAR |
| INSM1 | 0.00021023 | JASPAR |
| Klf4 | 0.00051463 | JASPAR |
| PPARG | 0.014717 | JASPAR |
|
| ||
| Sites: 45/100 | e-val: 0.000000000017 | ||
| Factor | e-val(match) | DB |
| SP1 | 0.000013015 | JASPAR |
| RREB1 | 0.00057128 | JASPAR |
| Pax4 | 0.0018909 | JASPAR |
| Klf4 | 0.004053 | JASPAR |
| Pax5 | 0.0078447 | JASPAR |
|
| ||
| Sites: 27/100 | e-val: 0.018 | ||
| Factor | e-val(match) | DB |
| Myf | 0.000000048302 | JASPAR |
| NHLH1 | 0.00000076028 | JASPAR |
| Myb | 0.011676 | JASPAR |
| ZEB1 | 0.025156 | JASPAR |
| TAL1::TCF3 | 0.026528 | JASPAR |
BED file downloads
Top 10 Example Regions
| Location | Gene Link | Dist. |
|---|---|---|
| chr1: 55267220-55267370 | TTC22 | 34.17 |
| chr1: 55267220-55267370 | TTC4 | 34.17 |
| chr1: 226150185-226150335 | H3F3A | 46.86 |
| chr1: 226150185-226150335 | LEFTY1 | 46.86 |
| chr1: 226150185-226150335 | RP4-559A3.7 | 46.86 |
| chr1: 226150185-226150335 | PYCR2 | 46.86 |
| chr10: 98479680-98479830 | PIK3AP1 | 52.46 |
| chr10: 98479680-98479830 | RP11-34E5.4 | 52.46 |
| chr19: 50836640-50836790 | POLD1 | 55.55 |
| chr19: 50836640-50836790 | NAPSB | 55.55 |