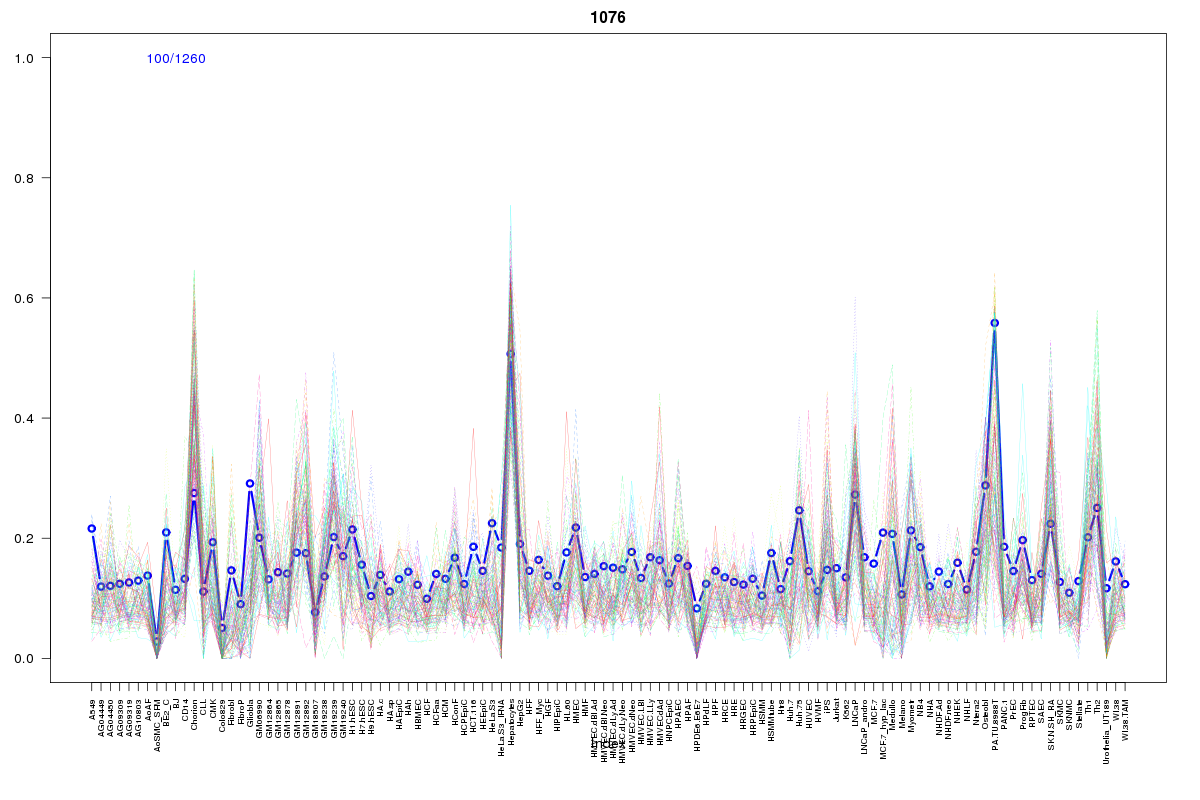
SOM cluster: 1076
Cluster Hypersensitivity Profile

Genomic Location Trend
These plots show the distribution of the DHS sites surrounding the Transcript Start Site of the nearest gene.
Stats
Number of sites: 1260Promoter: 10%
CpG-Island: 21%
Conserved: 40%
Enriched Motifs & Matches
Match Detail: [Jaspar]
|
| ||
|---|---|---|
| Sites: 98/100 | e-val: 0 | ||
| Factor | e-val(match) | DB |
| SP1 | 0.00000018181 | JASPAR |
| Tal1::Gata1 | 0.0019243 | JASPAR |
| Klf4 | 0.0023971 | JASPAR |
| Pax4 | 0.0068653 | JASPAR |
| INSM1 | 0.0071531 | JASPAR |
|
| ||
| Sites: 71/100 | e-val: 7.7e-24 | ||
| Factor | e-val(match) | DB |
| SP1 | 0.00047975 | JASPAR |
| PLAG1 | 0.0038461 | JASPAR |
| NR4A2 | 0.0068836 | JASPAR |
| HNF4A | 0.011716 | JASPAR |
| TFAP2A | 0.012676 | JASPAR |
|
| ||
| Sites: 68/100 | e-val: 0.00000000000065 | ||
| Factor | e-val(match) | DB |
| EBF1 | 0.00027454 | JASPAR |
| Zfp423 | 0.00096925 | JASPAR |
| Stat3 | 0.0011092 | JASPAR |
| TFAP2A | 0.0073557 | JASPAR |
| Egr1 | 0.0078835 | JASPAR |
BED file downloads
Top 10 Example Regions
| Location | Gene Link | Dist. |
|---|---|---|
| chr9: 139562965-139563115 | FAM69B | 33.16 |
| chr1: 150945805-150945955 | FAM63A | 41.78 |
| chr9: 139095185-139095335 | C9orf69 | 42.48 |
| chr9: 139558765-139558915 | EGFL7 | 48.75 |
| chr6: 1312505-1312655 | FOXQ1 | 50.03 |
| chr19: 33929165-33929315 | PEPD | 50.27 |
| chr12: 132313665-132313815 | PUS1 | 52.67 |
| chr16: 89778825-89778975 | VPS9D1 | 52.93 |
| chr11: 1859360-1859510 | AC068580.6 | 55.58 |
| chr11: 1859360-1859510 | LSP1 | 55.58 |