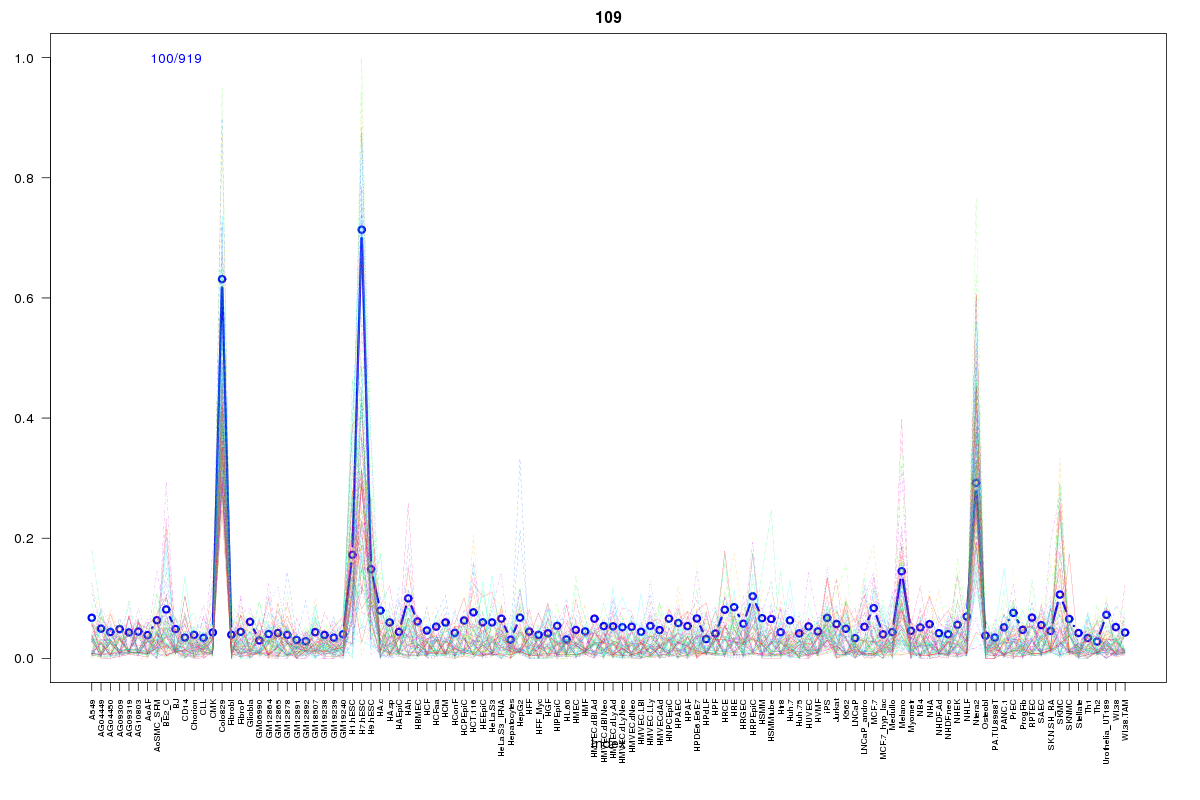
SOM cluster: 109
Cluster Hypersensitivity Profile

Genomic Location Trend
These plots show the distribution of the DHS sites surrounding the Transcript Start Site of the nearest gene.
Stats
Number of sites: 919Promoter: 2%
CpG-Island: 0%
Conserved: 39%
Enriched Motifs & Matches
Match Detail: [Jaspar]
|
| ||
|---|---|---|
| Sites: 19/100 | e-val: 1.2 | ||
| Factor | e-val(match) | DB |
| SP1 | 0.001035 | JASPAR |
| ZNF354C | 0.0020374 | JASPAR |
| EWSR1-FLI1 | 0.0030389 | JASPAR |
| Pax4 | 0.0032693 | JASPAR |
| FEV | 0.022148 | JASPAR |
BED file downloads
Top 10 Example Regions
| Location | Gene Link | Dist. |
|---|---|---|
| chr7: 42232460-42232610 | GLI3 | 46.33 |
| chr3: 58577960-58578110 | KCTD6 | 50.47 |
| chr1: 151267785-151267935 | PIP5K1A | 52.31 |
| chr1: 170418000-170418150 | GORAB | 53.86 |
| chr6: 123100280-123100430 | FABP7 | 56.67 |
| chr1: 161050460-161050610 | PFDN2 | 57.45 |
| chr1: 161050460-161050610 | DEDD | 57.45 |
| chr1: 161502400-161502550 | RPS23P10 | 58.63 |
| chr4: 85139280-85139430 | RP11-8L2.1 | 60.56 |
| chr1: 204034920-204035070 | SOX13 | 61.99 |