SOM cluster: 1090
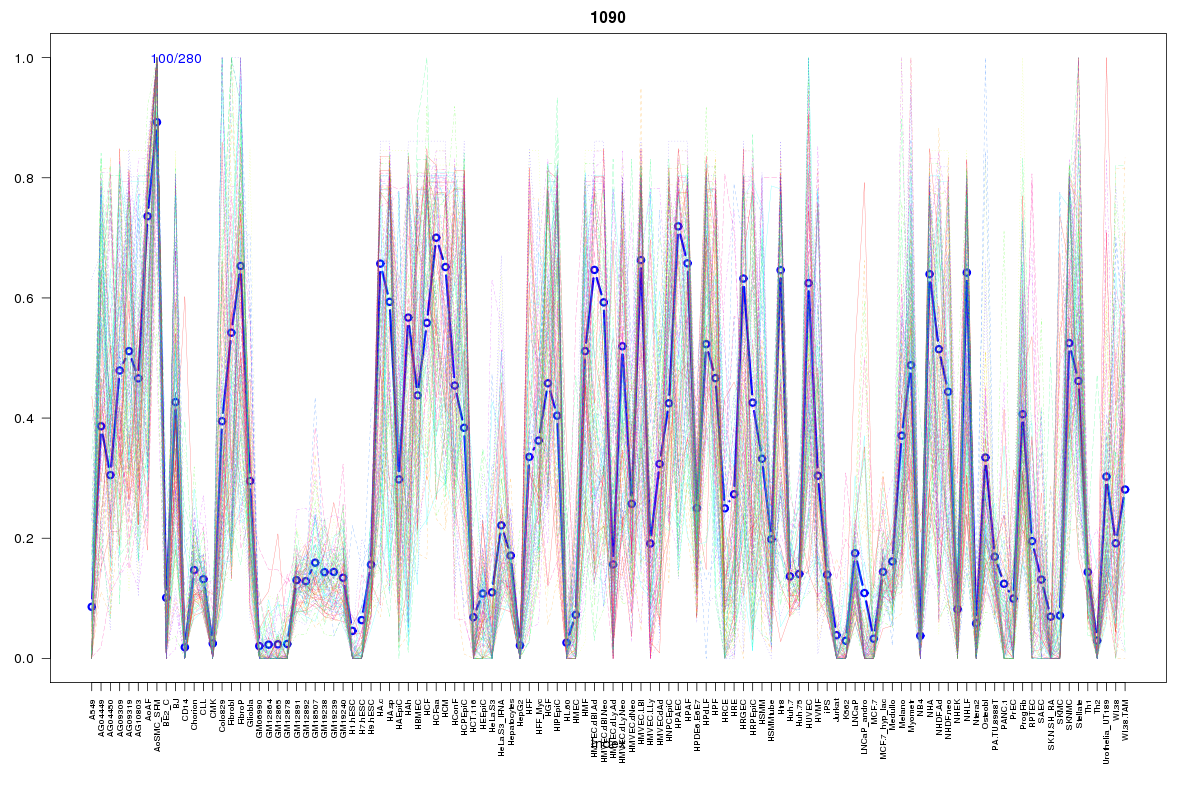
Cluster Hypersensitivity Profile

Genomic Location Trend
These plots show the distribution of the DHS sites surrounding the Transcript Start Site of the nearest gene.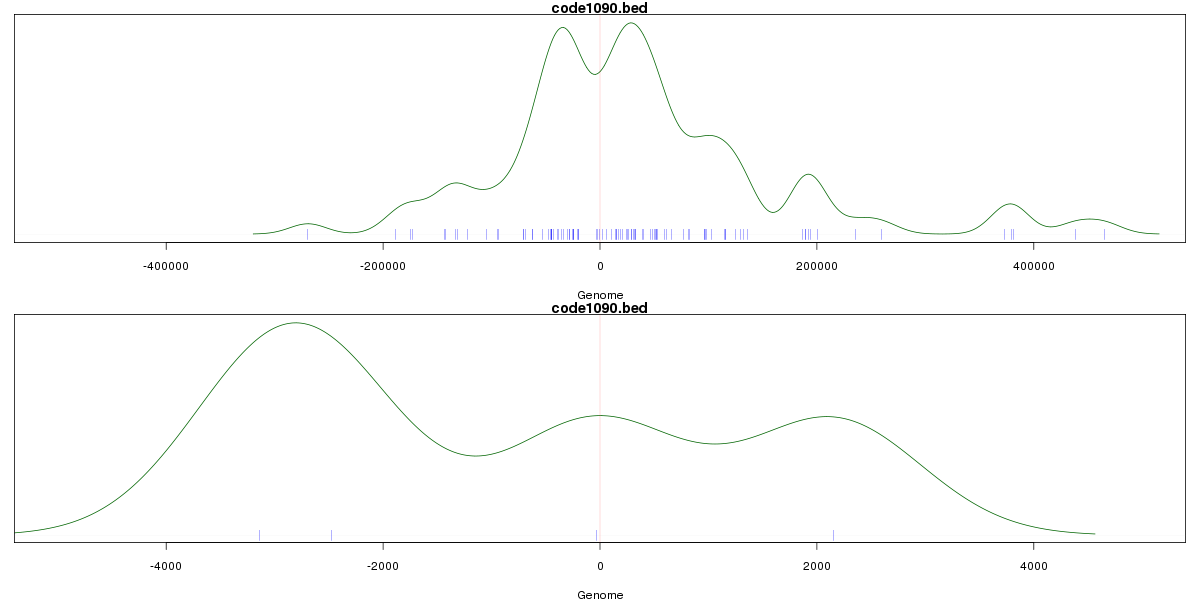
Stats
Number of sites: 280Promoter: 1%
CpG-Island: 0%
Conserved: 59%
Enriched Motifs & Matches
Match Detail: [Jaspar]
|
| ||
|---|---|---|
| Sites: 25/100 | e-val: 0.0000052 | ||
| Factor | e-val(match) | DB |
| Foxd3 | 0.000048334 | JASPAR |
| Pax4 | 0.00035821 | JASPAR |
| NFATC2 | 0.0023947 | JASPAR |
| MEF2A | 0.0035762 | JASPAR |
| NR3C1 | 0.0040166 | JASPAR |
BED file downloads
Top 10 Example Regions
| Location | Gene Link | Dist. |
|---|---|---|
| chr1: 149399320-149399470 | RP11-403I13.9 | 13.02 |
| chr1: 198092380-198092530 | NEK7 | 43.04 |
| chrX: 12996840-12996990 | TLR8-AS1 | 43.39 |
| chr2: 55327100-55327250 | RNU6-433P | 47.12 |
| chr2: 55327100-55327250 | RTN4 | 47.12 |
| chr6: 52461460-52461610 | TRAM2 | 48.66 |
| chr6: 52461460-52461610 | TRAM2-AS1 | 48.66 |
| chr4: 114495820-114495970 | CAMK2D | 48.95 |
| chr9: 107641960-107642110 | ABCA1 | 51.88 |
| chr2: 152190860-152191010 | RIF1 | 52.98 |