SOM cluster: 1091
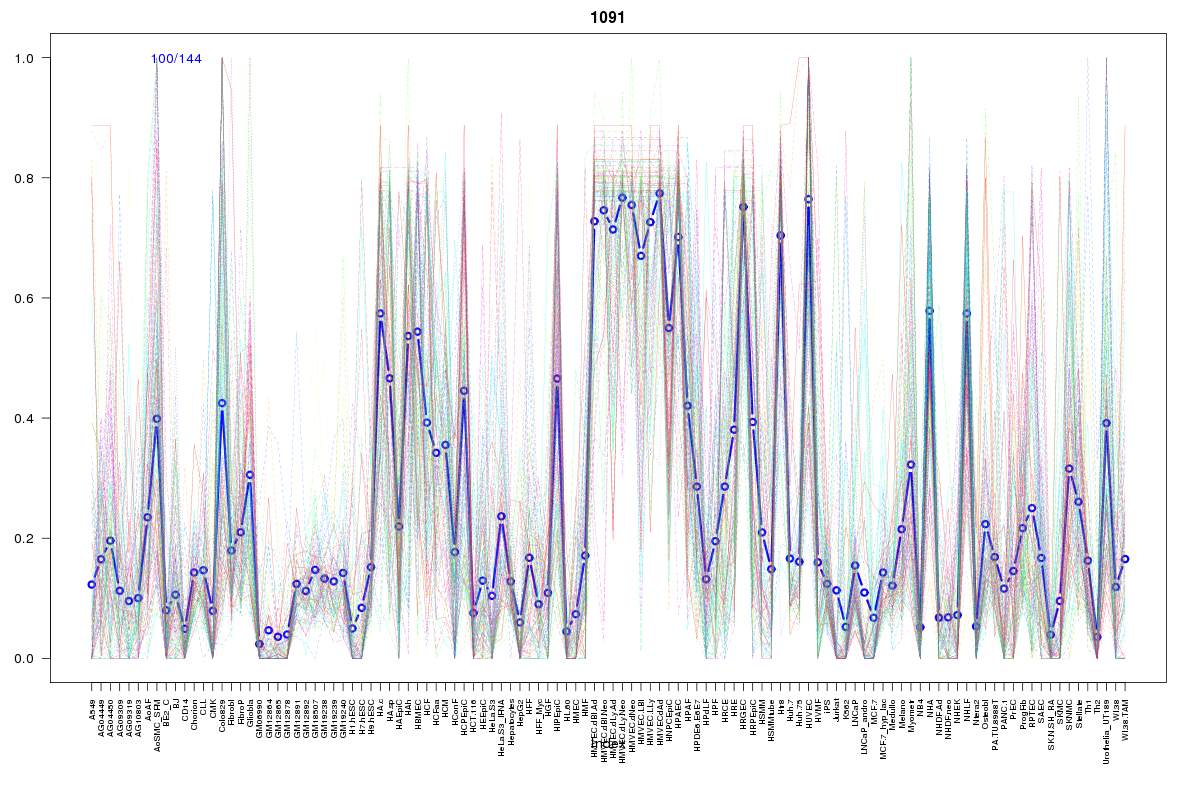
Cluster Hypersensitivity Profile

Genomic Location Trend
These plots show the distribution of the DHS sites surrounding the Transcript Start Site of the nearest gene.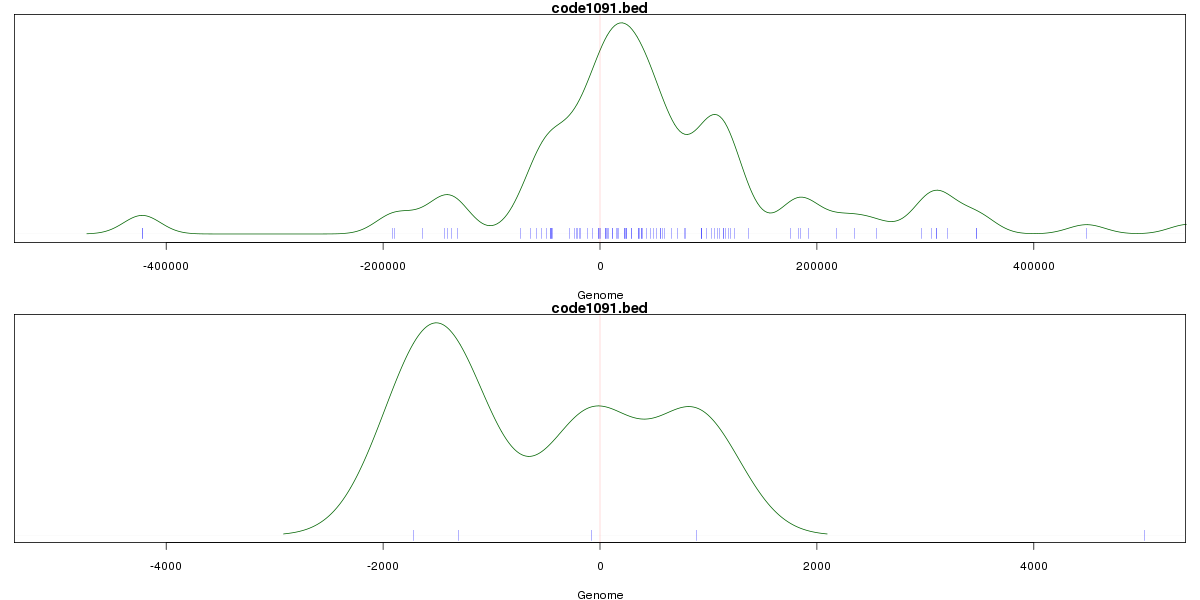
Stats
Number of sites: 144Promoter: 3%
CpG-Island: 0%
Conserved: 49%
Enriched Motifs & Matches
Match Detail: [Jaspar]
|
| ||
|---|---|---|
| Sites: 30/100 | e-val: 0.0059 | ||
| Factor | e-val(match) | DB |
| Foxd3 | 0.000000000053106 | JASPAR |
| FOXI1 | 0.00000000070308 | JASPAR |
| Foxq1 | 0.000031989 | JASPAR |
| FOXF2 | 0.00010415 | JASPAR |
| FOXA1 | 0.00012239 | JASPAR |
BED file downloads
Top 10 Example Regions
| Location | Gene Link | Dist. |
|---|---|---|
| chr10: 15386920-15387070 | FAM171A1 | 37.63 |
| chr3: 129328780-129328930 | PLXND1 | 42.59 |
| chr3: 129328780-129328930 | H1FOO | 42.59 |
| chr19: 34810760-34810910 | KIAA0355 | 44.76 |
| chr12: 79848140-79848290 | RN7SL696P | 54.71 |
| chr12: 79848140-79848290 | RP1-78O14.1 | 54.71 |
| chr1: 94557920-94558070 | RP11-78O9.1 | 56.52 |
| chr1: 94557920-94558070 | snoU13 | 56.52 |
| chr5: 179453460-179453610 | RNF130 | 57.13 |
| chr7: 101864320-101864470 | SH2B2 | 57.27 |