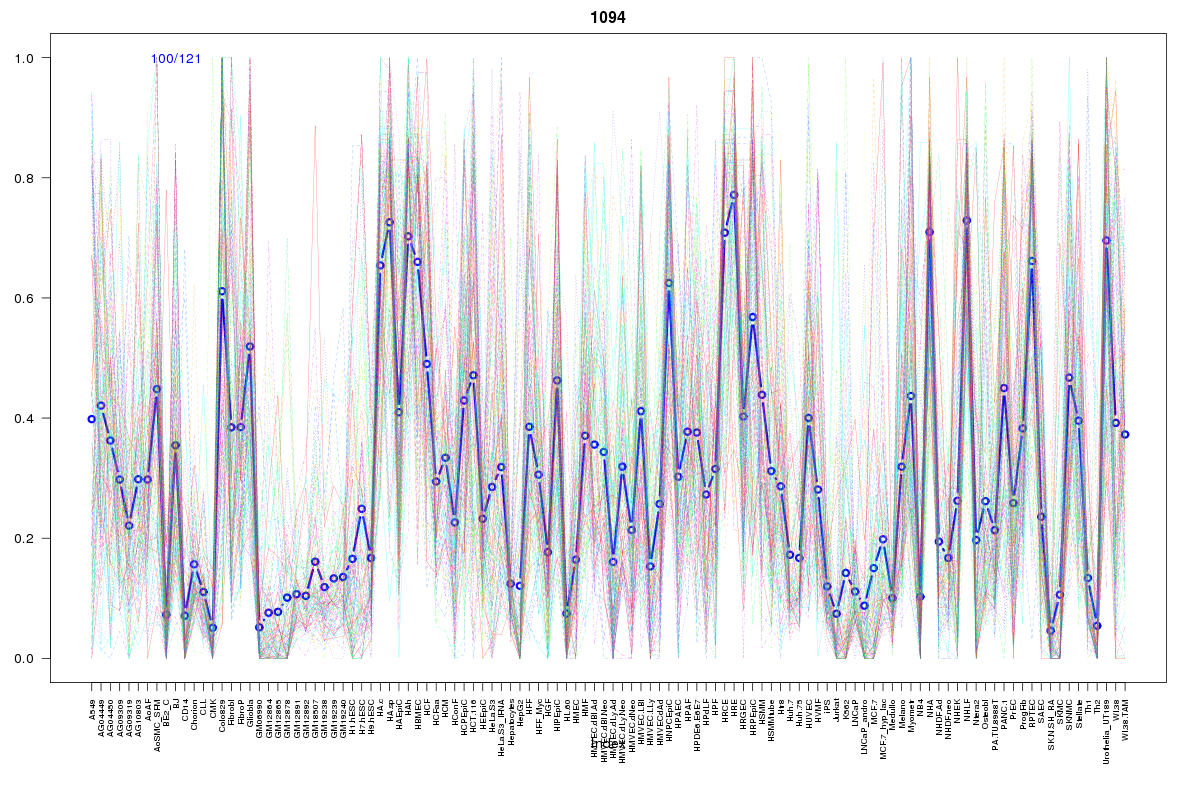
SOM cluster: 1094
Cluster Hypersensitivity Profile

Genomic Location Trend
These plots show the distribution of the DHS sites surrounding the Transcript Start Site of the nearest gene.
Stats
Number of sites: 121Promoter: 6%
CpG-Island: 0%
Conserved: 50%
Enriched Motifs & Matches
Match Detail: [Jaspar]
|
| ||
|---|---|---|
| Sites: 37/100 | e-val: 0.000000000000079 | ||
| Factor | e-val(match) | DB |
| AP1 | 0.000000000042182 | JASPAR |
| NFE2L2 | 0.0000000054105 | JASPAR |
| PPARG | 0.0029601 | JASPAR |
| NFE2L1::MafG | 0.0044006 | JASPAR |
| Pax6 | 0.015399 | JASPAR |
BED file downloads
Top 10 Example Regions
| Location | Gene Link | Dist. |
|---|---|---|
| chr4: 169717620-169717770 | RPL9P16 | 49.35 |
| chr4: 169717620-169717770 | PALLD | 49.35 |
| chr2: 168366200-168366350 | AC074363.1 | 54.73 |
| chr1: 85992800-85992950 | CYR61 | 59.62 |
| chr1: 85992800-85992950 | RP11-131L23.1 | 59.62 |
| chr22: 36746800-36746950 | MYH9 | 64.55 |
| chr11: 12185840-12185990 | MICAL2 | 64.83 |
| chr11: 12185840-12185990 | RP13-631K18.5 | 64.83 |
| chr8: 145993780-145993930 | AF186192.5 | 67.39 |
| chr7: 137871700-137871850 | AKR1D1 | 67.64 |