SOM cluster: 1105
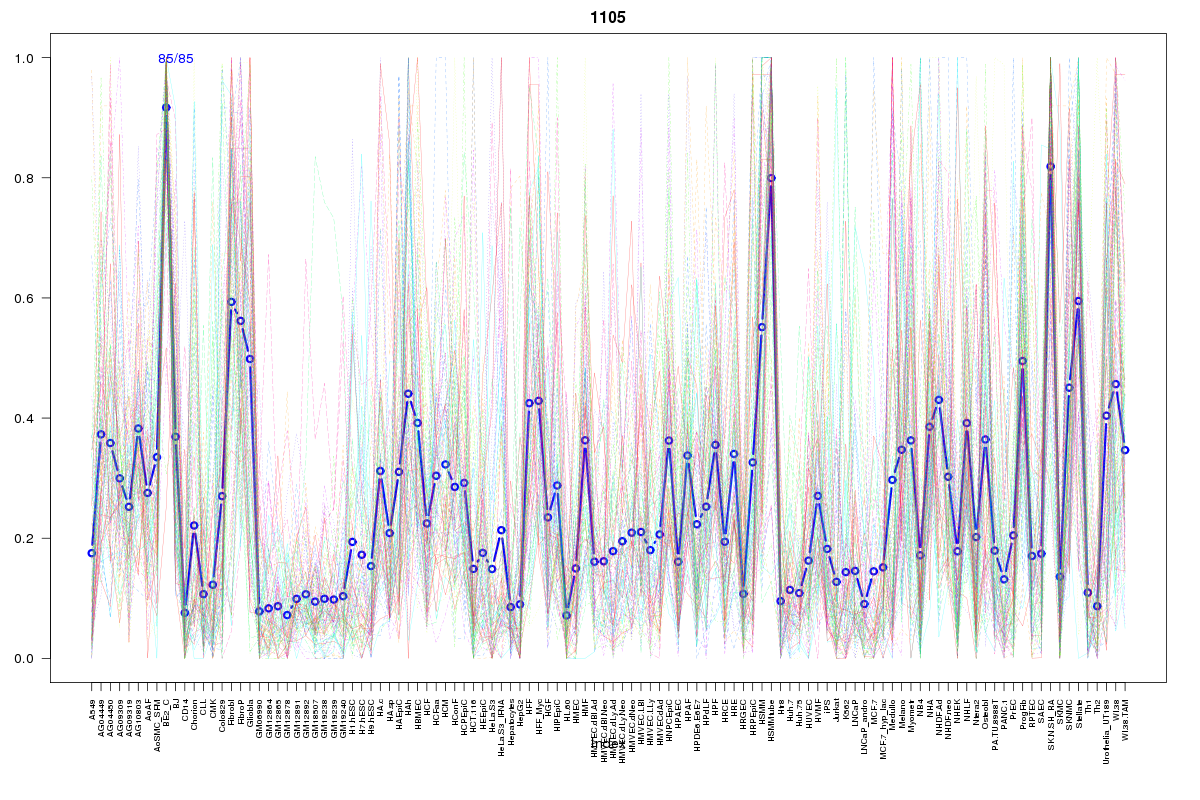
Cluster Hypersensitivity Profile

Genomic Location Trend
These plots show the distribution of the DHS sites surrounding the Transcript Start Site of the nearest gene.
Stats
Number of sites: 85Promoter: 8%
CpG-Island: 3%
Conserved: 48%
Enriched Motifs & Matches
Match Detail: [Jaspar]
|
| ||
|---|---|---|
| Sites: 81/85 | e-val: 0.0000000000000077 | ||
| Factor | e-val(match) | DB |
| AP1 | 0.0018711 | JASPAR |
| SPI1 | 0.017318 | JASPAR |
| Hand1::Tcfe2a | 0.020279 | JASPAR |
| INSM1 | 0.025354 | JASPAR |
| TEAD1 | 0.029696 | JASPAR |
|
| ||
| Sites: 33/85 | e-val: 0.000000000017 | ||
| Factor | e-val(match) | DB |
| Myf | 0.00000012244 | JASPAR |
| NHLH1 | 0.00020795 | JASPAR |
| TAL1::TCF3 | 0.010532 | JASPAR |
| TFAP2A | 0.016583 | JASPAR |
| Tcfcp2l1 | 0.0302 | JASPAR |
|
| ||
| Sites: 26/85 | e-val: 0.0019 | ||
| Factor | e-val(match) | DB |
| INSM1 | 0.00021983 | JASPAR |
| Tcfcp2l1 | 0.0020327 | JASPAR |
| Stat3 | 0.0023328 | JASPAR |
| SP1 | 0.0026035 | JASPAR |
| Hand1::Tcfe2a | 0.0081479 | JASPAR |
BED file downloads
Top 10 Example Regions
| Location | Gene Link | Dist. |
|---|---|---|
| chr11: 43945480-43945630 | ALKBH3-AS1 | 62.57 |
| chr17: 55888640-55888790 | CUEDC1 | 65.56 |
| chr1: 201237860-201238010 | RP11-567E21.3 | 75.96 |
| chr6: 170747385-170747535 | FAM120B | 80.55 |
| chr19: 39182865-39183015 | MAP4K1 | 82.74 |
| chr22: 30647780-30647930 | TBC1D10A | 82.87 |
| chr22: 30647780-30647930 | LIF | 82.87 |
| chr22: 30647780-30647930 | RP1-130H16.18 | 82.87 |
| chrX: 39586160-39586310 | GAPDHP1 | 88.28 |
| chr1: 32277340-32277490 | BAI2 | 93.09 |