SOM cluster: 1107
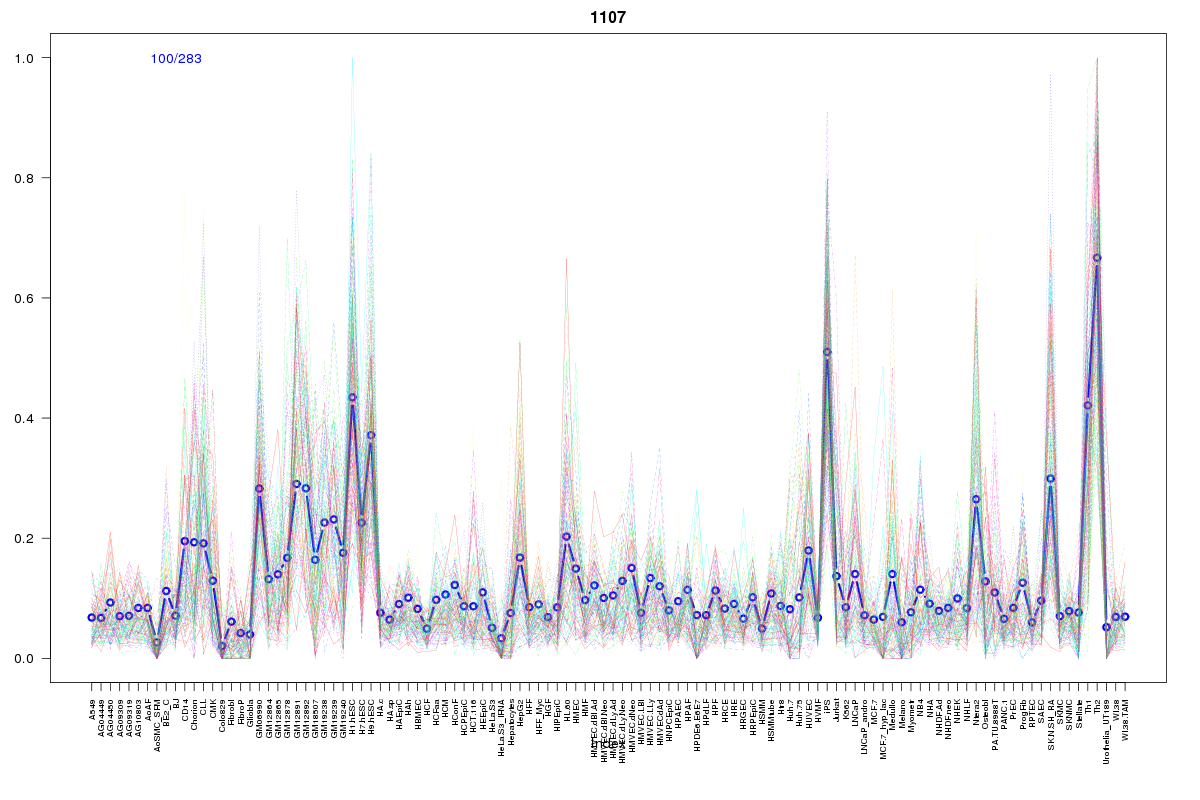
Cluster Hypersensitivity Profile

Genomic Location Trend
These plots show the distribution of the DHS sites surrounding the Transcript Start Site of the nearest gene.
Stats
Number of sites: 283Promoter: 13%
CpG-Island: 83%
Conserved: 66%
Enriched Motifs & Matches
Match Detail: [Jaspar]
|
| ||
|---|---|---|
| Sites: 99/100 | e-val: 0 | ||
| Factor | e-val(match) | DB |
| SP1 | 0.000000103 | JASPAR |
| PLAG1 | 0.0016558 | JASPAR |
| Egr1 | 0.0021876 | JASPAR |
| TFAP2A | 0.0022808 | JASPAR |
| Klf4 | 0.0033935 | JASPAR |
|
| ||
| Sites: 99/100 | e-val: 6.9e-36 | ||
| Factor | e-val(match) | DB |
| SP1 | 0.000011869 | JASPAR |
| PLAG1 | 0.0017393 | JASPAR |
| TFAP2A | 0.0046621 | JASPAR |
| Zfx | 0.01789 | JASPAR |
| Klf4 | 0.02769 | JASPAR |
|
| ||
| Sites: 76/100 | e-val: 0.015 | ||
| Factor | e-val(match) | DB |
| SP1 | 0.000060442 | JASPAR |
| INSM1 | 0.00008501 | JASPAR |
| TFAP2A | 0.000577 | JASPAR |
| CTCF | 0.00066037 | JASPAR |
| Myf | 0.0035646 | JASPAR |
BED file downloads
Top 10 Example Regions
| Location | Gene Link | Dist. |
|---|---|---|
| chr2: 85107980-85108130 | TMSB10 | 42.79 |
| chr2: 85107980-85108130 | KCMF1 | 42.79 |
| chr2: 85107980-85108130 | TRABD2A | 42.79 |
| chr19: 18119205-18119355 | IL12RB1 | 44.14 |
| chr19: 19748625-19748775 | ZNF101 | 45.66 |
| chr8: 10873685-10873835 | XKR6 | 45.78 |
| chr8: 10873685-10873835 | AF131215.2 | 45.78 |
| chr17: 62774940-62775090 | LRRC37A3 | 48.72 |
| chr8: 9764080-9764230 | snoU13 | 53.4 |
| chr19: 19651140-19651290 | YJEFN3 | 56.19 |