SOM cluster: 1108
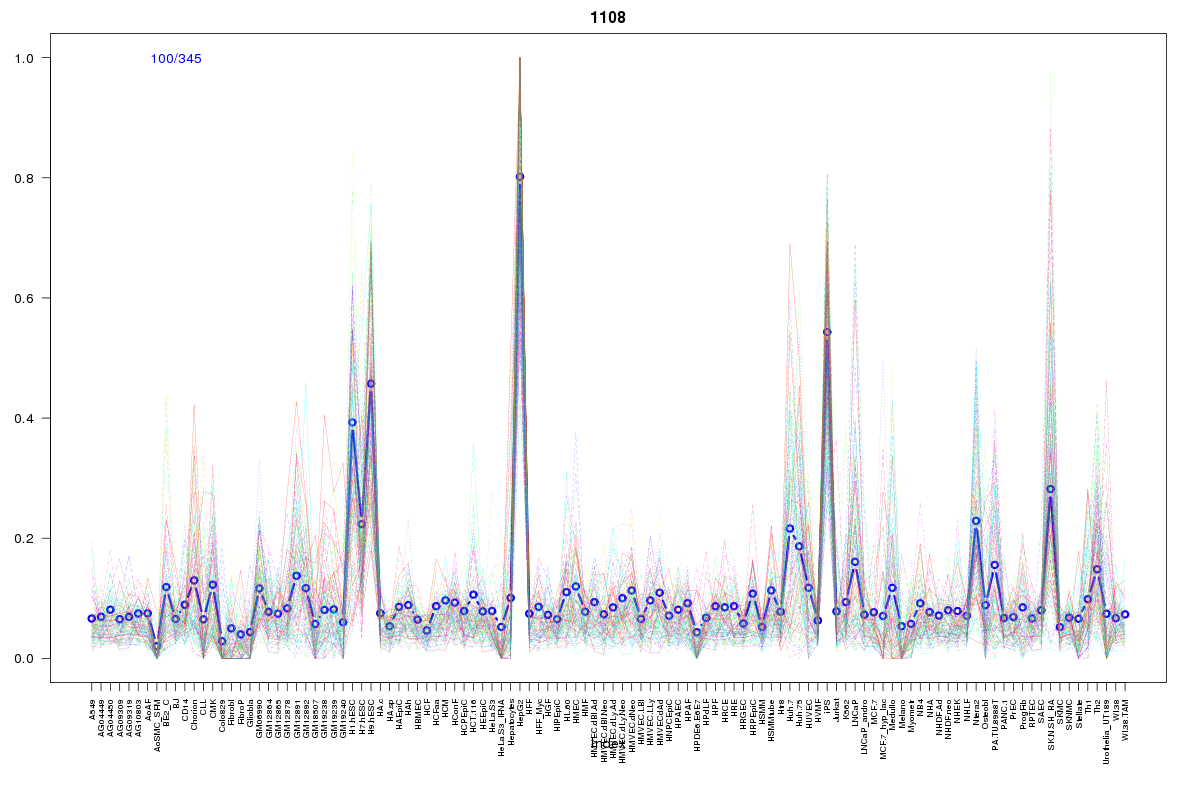
Cluster Hypersensitivity Profile

Genomic Location Trend
These plots show the distribution of the DHS sites surrounding the Transcript Start Site of the nearest gene.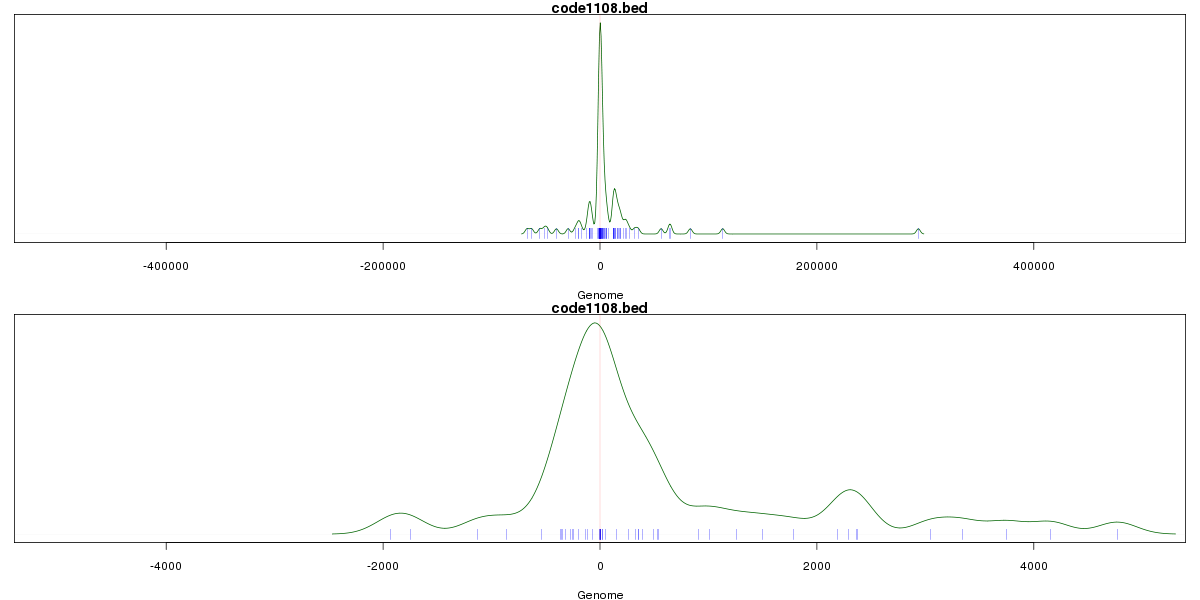
Stats
Number of sites: 345Promoter: 24%
CpG-Island: 54%
Conserved: 62%
Enriched Motifs & Matches
Match Detail: [Jaspar]
|
| ||
|---|---|---|
| Sites: 88/100 | e-val: 0 | ||
| Factor | e-val(match) | DB |
| SP1 | 0.00000051879 | JASPAR |
| TFAP2A | 0.00099979 | JASPAR |
| Egr1 | 0.0068676 | JASPAR |
| PLAG1 | 0.007111 | JASPAR |
| RREB1 | 0.010864 | JASPAR |
|
| ||
| Sites: 77/100 | e-val: 2e-29 | ||
| Factor | e-val(match) | DB |
| SP1 | 0.0000008712 | JASPAR |
| TFAP2A | 0.00019728 | JASPAR |
| INSM1 | 0.0002486 | JASPAR |
| PLAG1 | 0.0029399 | JASPAR |
| Tal1::Gata1 | 0.0048186 | JASPAR |
BED file downloads
Top 10 Example Regions
| Location | Gene Link | Dist. |
|---|---|---|
| chr9: 127267225-127267375 | NR5A1 | 38.67 |
| chr9: 127267225-127267375 | NR6A1 | 38.67 |
| chr7: 150038640-150038790 | RARRES2 | 48.26 |
| chr9: 138371265-138371415 | PPP1R26 | 51.42 |
| chr17: 70120205-70120355 | SOX9 | 53.95 |
| chr17: 70120205-70120355 | AC005152.3 | 53.95 |
| chr17: 70120205-70120355 | LINC01152 | 53.95 |
| chr6: 3906240-3906390 | FAM50B | 58.83 |
| chr19: 1285645-1285795 | MUM1 | 59.85 |
| chr20: 60730505-60730655 | TAF4 | 62.19 |