SOM cluster: 1140
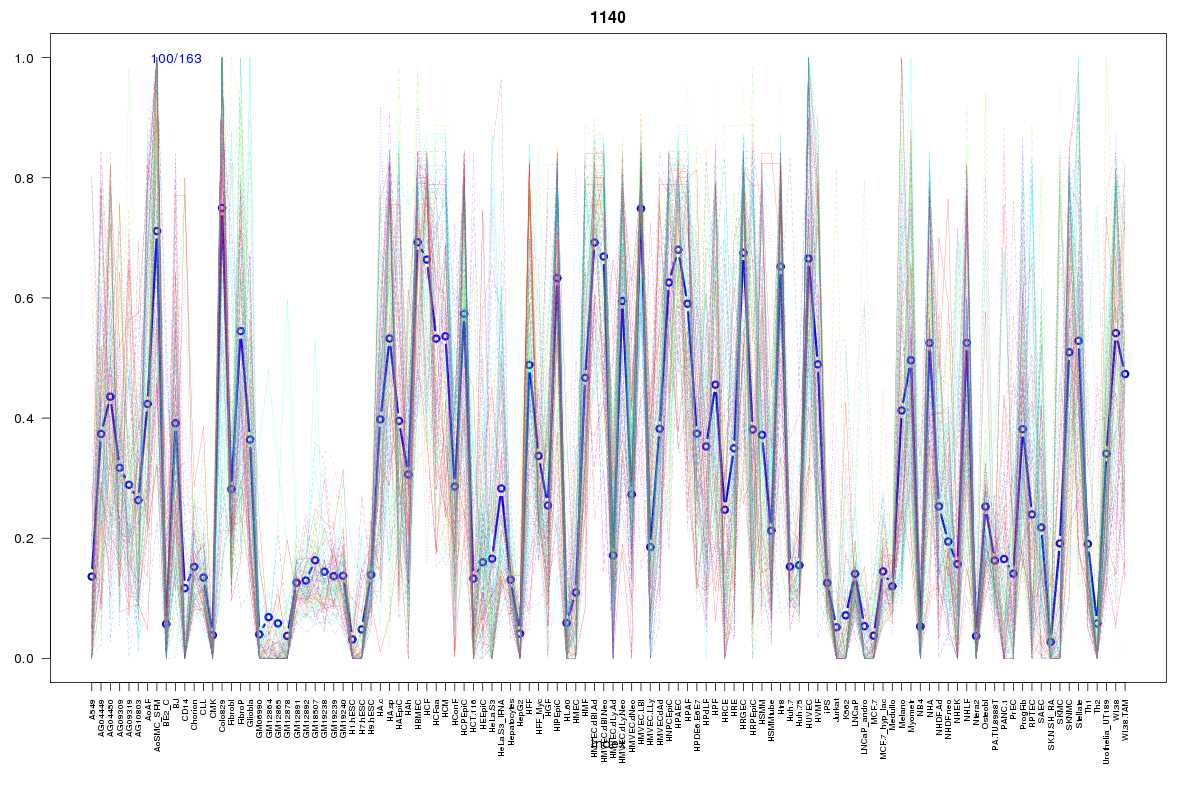
Cluster Hypersensitivity Profile

Genomic Location Trend
These plots show the distribution of the DHS sites surrounding the Transcript Start Site of the nearest gene.
Stats
Number of sites: 163Promoter: 3%
CpG-Island: 0%
Conserved: 64%
Enriched Motifs & Matches
Match Detail: [Jaspar]
|
| ||
|---|---|---|
| Sites: 59/100 | e-val: 4.1e-24 | ||
| Factor | e-val(match) | DB |
| AP1 | 0.0000000018813 | JASPAR |
| NFE2L2 | 0.0000000073307 | JASPAR |
| NFE2L1::MafG | 0.00033584 | JASPAR |
| PBX1 | 0.0019076 | JASPAR |
| Pdx1 | 0.017424 | JASPAR |
|
| ||
| Sites: 21/100 | e-val: 0.000053 | ||
| Factor | e-val(match) | DB |
| Foxd3 | 0.00040612 | JASPAR |
| MEF2A | 0.00092006 | JASPAR |
| HNF1B | 0.0024845 | JASPAR |
| Foxq1 | 0.0028683 | JASPAR |
| Evi1 | 0.0030305 | JASPAR |
|
| ||
| Sites: 29/100 | e-val: 0.043 | ||
| Factor | e-val(match) | DB |
| FOXO3 | 0.0029845 | JASPAR |
| NFATC2 | 0.0065718 | JASPAR |
| Foxq1 | 0.0074217 | JASPAR |
| Foxd3 | 0.0095292 | JASPAR |
| Pou5f1 | 0.0098661 | JASPAR |
BED file downloads
Top 10 Example Regions
| Location | Gene Link | Dist. |
|---|---|---|
| chr6: 121969160-121969310 | RP11-129H15.1 | 30.24 |
| chr5: 114791040-114791190 | FEM1C | 36.84 |
| chr5: 72118240-72118390 | TNPO1 | 39.89 |
| chr2: 150504920-150505070 | RNU6-601P | 42.62 |
| chr7: 45030120-45030270 | MYO1G | 43.21 |
| chr8: 49650580-49650730 | RP11-770E5.1 | 48.7 |
| chr1: 61647840-61647990 | NFIA | 51.89 |
| chr2: 159948020-159948170 | TANC1 | 57.67 |
| chr3: 141145340-141145490 | KRT18P35 | 61.14 |
| chr2: 69273580-69273730 | ANTXR1 | 62.23 |