SOM cluster: 1146
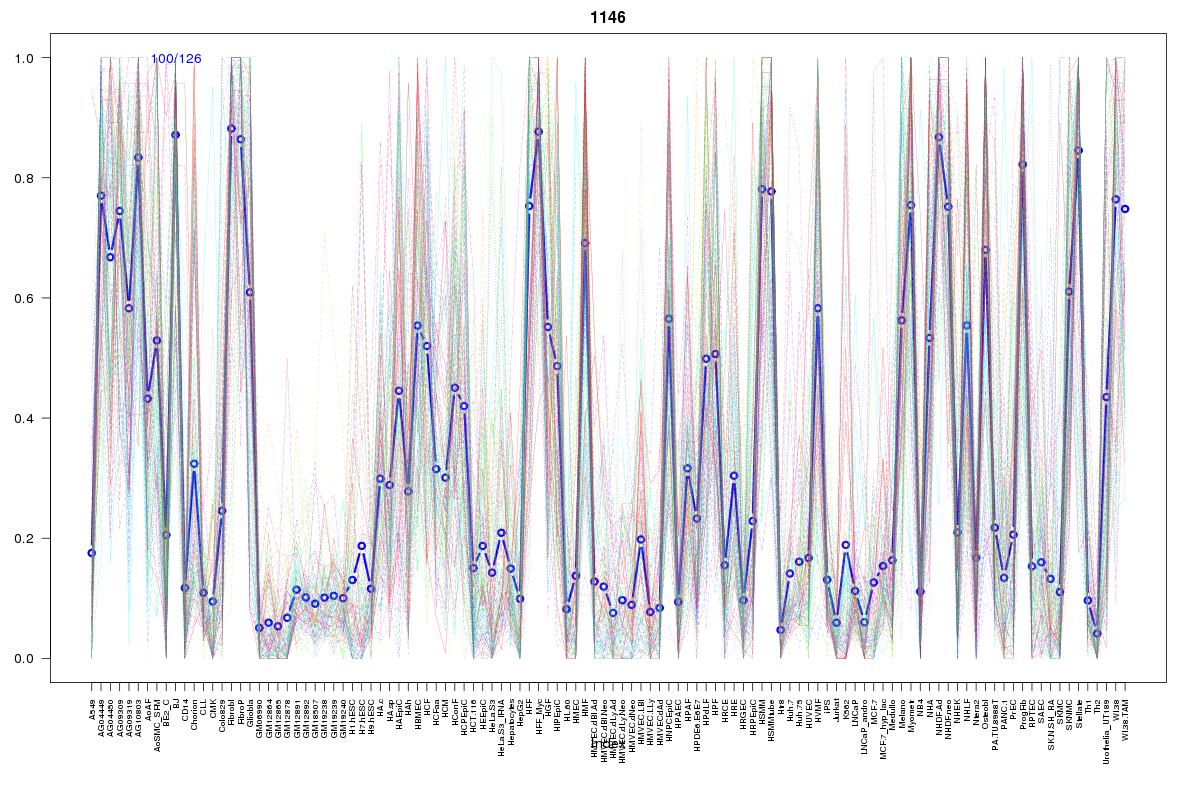
Cluster Hypersensitivity Profile

Genomic Location Trend
These plots show the distribution of the DHS sites surrounding the Transcript Start Site of the nearest gene.
Stats
Number of sites: 126Promoter: 6%
CpG-Island: 1%
Conserved: 38%
Enriched Motifs & Matches
Match Detail: [Jaspar]
|
| ||
|---|---|---|
| Sites: 36/100 | e-val: 0.00000000026 | ||
| Factor | e-val(match) | DB |
| NFE2L2 | 1.1102e-16 | JASPAR |
| AP1 | 0.000000014509 | JASPAR |
| NFE2L1::MafG | 0.0046483 | JASPAR |
| Pax2 | 0.0073903 | JASPAR |
| Mafb | 0.023516 | JASPAR |
|
| ||
| Sites: 23/100 | e-val: 0.0012 | ||
| Factor | e-val(match) | DB |
| Pax4 | 0.0000057435 | JASPAR |
| Klf4 | 0.000017621 | JASPAR |
| RREB1 | 0.000068897 | JASPAR |
| SP1 | 0.0033676 | JASPAR |
| MZF1_1-4 | 0.003715 | JASPAR |
|
| ||
| Sites: 15/100 | e-val: 0.029 | ||
| Factor | e-val(match) | DB |
| EWSR1-FLI1 | 0.00021771 | JASPAR |
| TLX1::NFIC | 0.0035267 | JASPAR |
| SPIB | 0.0063284 | JASPAR |
| RXR::RAR_DR5 | 0.0090388 | JASPAR |
| Sox2 | 0.010384 | JASPAR |
BED file downloads
Top 10 Example Regions
| Location | Gene Link | Dist. |
|---|---|---|
| chr17: 76386365-76386515 | DNAH17 | 52.69 |
| chr17: 76386365-76386515 | SNORA30 | 52.69 |
| chr17: 76386365-76386515 | RN7SL236P | 52.69 |
| chr2: 74230740-74230890 | ACTG2 | 54.95 |
| chr2: 74230740-74230890 | AC073046.25 | 54.95 |
| chr2: 74230740-74230890 | RP11-711M9.1 | 54.95 |
| chr8: 99179200-99179350 | NIPAL2 | 56.12 |
| chr8: 99179200-99179350 | C8orf47 | 56.12 |
| chr21: 46716000-46716150 | BX322557.10 | 61.62 |
| chr21: 46716000-46716150 | LINC00205 | 61.62 |