SOM cluster: 1148
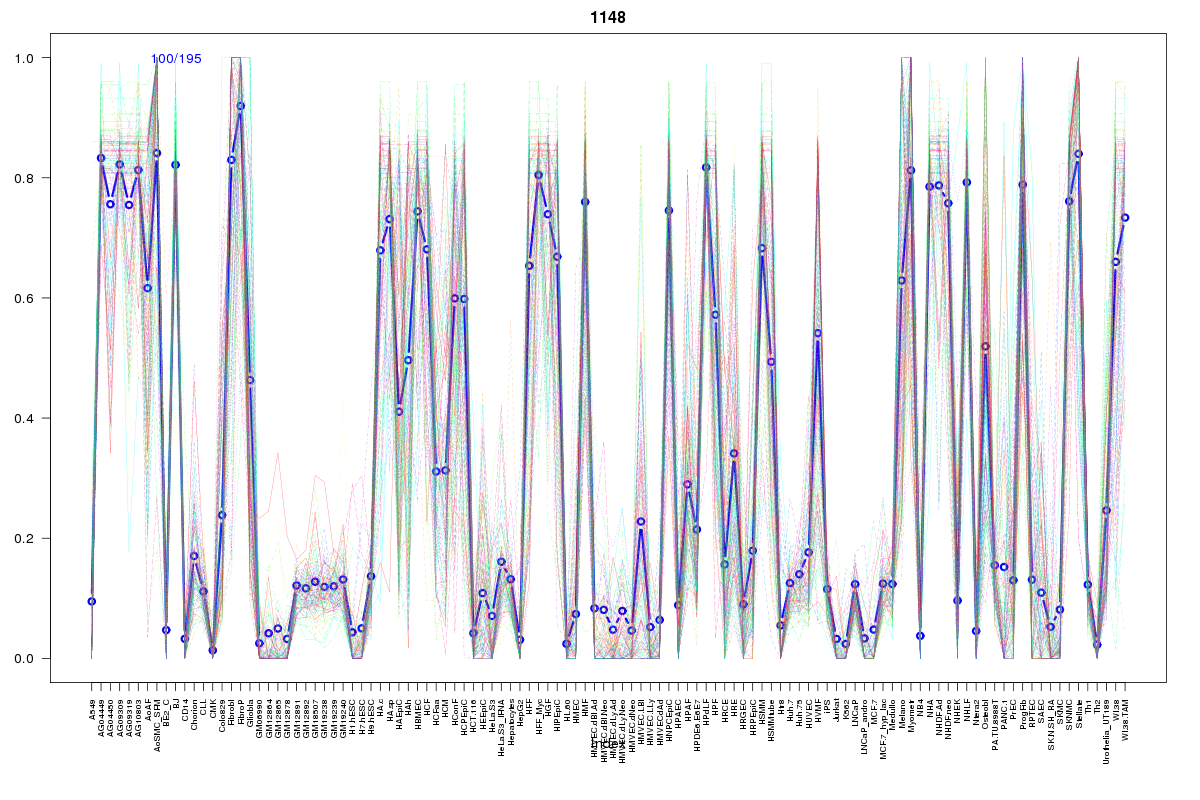
Cluster Hypersensitivity Profile

Genomic Location Trend
These plots show the distribution of the DHS sites surrounding the Transcript Start Site of the nearest gene.
Stats
Number of sites: 195Promoter: 0%
CpG-Island: 0%
Conserved: 62%
Enriched Motifs & Matches
Match Detail: [Jaspar]
|
| ||
|---|---|---|
| Sites: 34/100 | e-val: 0.0000000016 | ||
| Factor | e-val(match) | DB |
| AP1 | 0.000000000015136 | JASPAR |
| NFE2L2 | 0.000000053413 | JASPAR |
| PBX1 | 0.0021978 | JASPAR |
| PPARG | 0.0055806 | JASPAR |
| NFE2L1::MafG | 0.01613 | JASPAR |
|
| ||
| Sites: 31/100 | e-val: 0.0000085 | ||
| Factor | e-val(match) | DB |
| Foxd3 | 0.000000050293 | JASPAR |
| Foxq1 | 0.0000092188 | JASPAR |
| FOXF2 | 0.00068128 | JASPAR |
| Pax4 | 0.0021846 | JASPAR |
| FOXA1 | 0.0031438 | JASPAR |
BED file downloads
Top 10 Example Regions
| Location | Gene Link | Dist. |
|---|---|---|
| chr1: 145683005-145683155 | RNF115 | 14.35 |
| chr1: 145683005-145683155 | PIAS3 | 14.35 |
| chr1: 145683005-145683155 | PDZK1 | 14.35 |
| chr1: 54198760-54198910 | NDC1 | 32.1 |
| chr1: 54198760-54198910 | GLIS1 | 32.1 |
| chr8: 121681180-121681330 | SNTB1 | 40.16 |
| chr8: 121681180-121681330 | CTC-820M8.1 | 40.16 |
| chr7: 41926040-41926190 | GLI3 | 42.99 |
| chr7: 134878540-134878690 | C7orf49 | 43.69 |
| chr3: 8500480-8500630 | LMCD1 | 44.53 |