SOM cluster: 1156
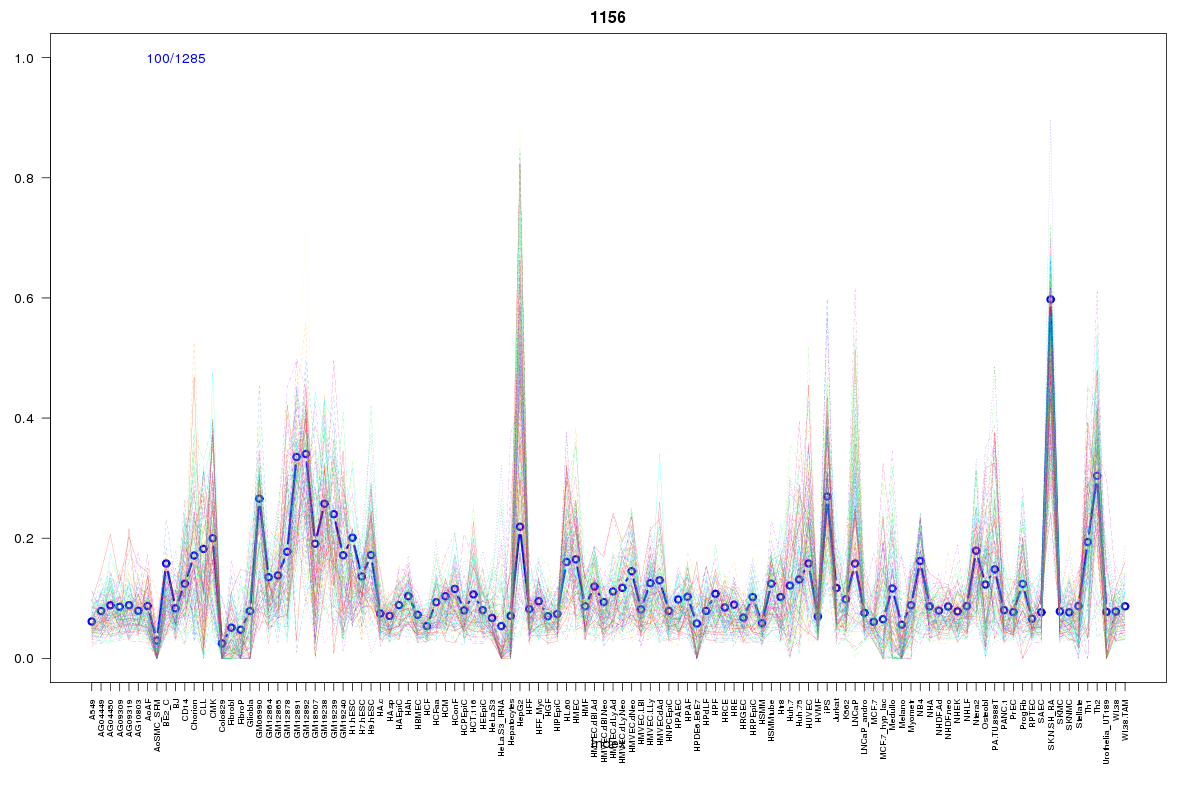
Cluster Hypersensitivity Profile

Genomic Location Trend
These plots show the distribution of the DHS sites surrounding the Transcript Start Site of the nearest gene.
Stats
Number of sites: 1285Promoter: 26%
CpG-Island: 84%
Conserved: 67%
Enriched Motifs & Matches
Match Detail: [Jaspar]
|
| ||
|---|---|---|
| Sites: 89/100 | e-val: 0 | ||
| Factor | e-val(match) | DB |
| SP1 | 0.0000027187 | JASPAR |
| TFAP2A | 0.000017549 | JASPAR |
| PLAG1 | 0.00053788 | JASPAR |
| Egr1 | 0.0080449 | JASPAR |
| INSM1 | 0.037191 | JASPAR |
|
| ||
| Sites: 66/100 | e-val: 0 | ||
| Factor | e-val(match) | DB |
| TFAP2A | 0.0000068109 | JASPAR |
| SP1 | 0.002195 | JASPAR |
| PLAG1 | 0.015755 | JASPAR |
| Klf4 | 0.019332 | JASPAR |
| TP53 | 0.020041 | JASPAR |
|
| ||
| Sites: 56/100 | e-val: 0.0000001 | ||
| Factor | e-val(match) | DB |
| SP1 | 0.00000023789 | JASPAR |
| TFAP2A | 0.000026844 | JASPAR |
| PLAG1 | 0.000053362 | JASPAR |
| Klf4 | 0.02641 | JASPAR |
| GABPA | 0.067561 | JASPAR |
BED file downloads
Top 10 Example Regions
| Location | Gene Link | Dist. |
|---|---|---|
| chr10: 82168640-82168790 | FAM213A | 33.22 |
| chr7: 139167885-139168035 | RP4-701O16.5 | 40.94 |
| chr12: 121078465-121078615 | POP5 | 45.98 |
| chr12: 121078465-121078615 | RP11-173P15.3 | 45.98 |
| chr12: 121078465-121078615 | CABP1 | 45.98 |
| chr19: 40972945-40973095 | HIPK4 | 47.17 |
| chr19: 40972945-40973095 | BLVRB | 47.17 |
| chr19: 35454765-35454915 | SCN1B | 48.84 |
| chr19: 35454765-35454915 | ZNF792 | 48.84 |
| chr2: 25538185-25538335 | DNMT3A | 49.13 |