SOM cluster: 1163
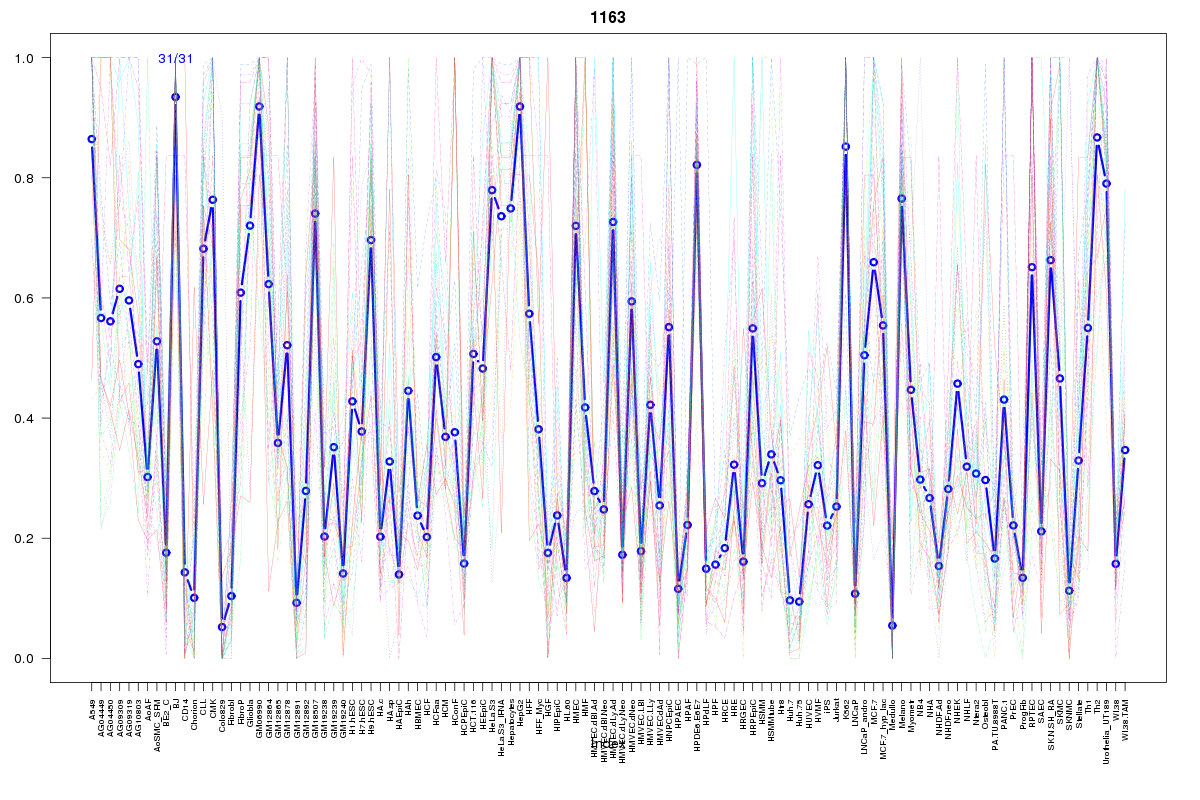
Cluster Hypersensitivity Profile

Genomic Location Trend
These plots show the distribution of the DHS sites surrounding the Transcript Start Site of the nearest gene.
Stats
Number of sites: 31Promoter: 6%
CpG-Island: 0%
Conserved: 30%
Enriched Motifs & Matches
Match Detail: [Jaspar]
|
| ||
|---|---|---|
| Sites: 30/31 | e-val: 0.00000000000041 | ||
| Factor | e-val(match) | DB |
| Pax4 | 0.00079266 | JASPAR |
| RREB1 | 0.0013261 | JASPAR |
| MZF1_5-13 | 0.0032896 | JASPAR |
| Pdx1 | 0.0094321 | JASPAR |
| Foxd3 | 0.046849 | JASPAR |
BED file downloads
Top 10 Example Regions
| Location | Gene Link | Dist. |
|---|---|---|
| chr5: 99385100-99385250 | EEF1A1P20 | 78.82 |
| chr5: 134259520-134259670 | CATSPER3 | 121.9 |
| chr5: 134259080-134259230 | CTB-36O1.7 | 151.73 |
| chr5: 134259080-134259230 | PCBD2 | 151.73 |