SOM cluster: 1167
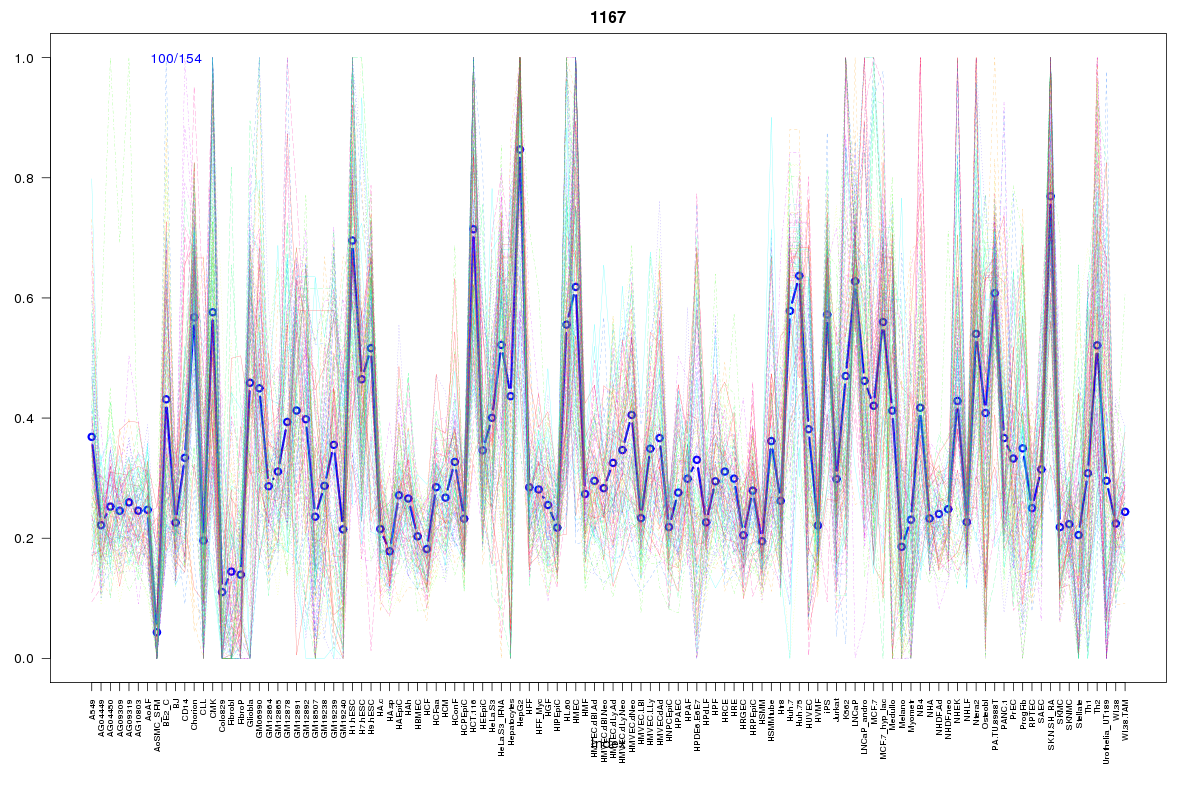
Cluster Hypersensitivity Profile

Genomic Location Trend
These plots show the distribution of the DHS sites surrounding the Transcript Start Site of the nearest gene.
Stats
Number of sites: 154Promoter: 35%
CpG-Island: 77%
Conserved: 57%
Enriched Motifs & Matches
Match Detail: [Jaspar]
|
| ||
|---|---|---|
| Sites: 98/100 | e-val: 0 | ||
| Factor | e-val(match) | DB |
| SP1 | 0.0000043018 | JASPAR |
| TFAP2A | 0.0000047421 | JASPAR |
| PLAG1 | 0.00043395 | JASPAR |
| Klf4 | 0.0012764 | JASPAR |
| Egr1 | 0.027701 | JASPAR |
|
| ||
| Sites: 91/100 | e-val: 1.5e-33 | ||
| Factor | e-val(match) | DB |
| SP1 | 0.000000023378 | JASPAR |
| TFAP2A | 0.00032544 | JASPAR |
| Klf4 | 0.00085868 | JASPAR |
| PLAG1 | 0.011006 | JASPAR |
| Zfx | 0.016173 | JASPAR |
|
| ||
| Sites: 64/100 | e-val: 0.00000000011 | ||
| Factor | e-val(match) | DB |
| TFAP2A | 0.000011062 | JASPAR |
| Klf4 | 0.00038072 | JASPAR |
| Myf | 0.00045979 | JASPAR |
| CTCF | 0.0035478 | JASPAR |
| PLAG1 | 0.0085615 | JASPAR |
BED file downloads
Top 10 Example Regions
| Location | Gene Link | Dist. |
|---|---|---|
| chr1: 150981460-150981610 | RP11-316M1.12 | 13.02 |
| chr1: 150981460-150981610 | PRUNE | 13.02 |
| chr1: 150981460-150981610 | SETDB1 | 13.02 |
| chr1: 169075000-169075150 | ATP1B1 | 28.48 |
| chr9: 133320140-133320290 | snoU13 | 39.06 |
| chr9: 130564740-130564890 | ENG | 45.83 |
| chr9: 130564740-130564890 | TOR2A | 45.83 |
| chr9: 130564740-130564890 | ST6GALNAC6 | 45.83 |
| chr3: 138654885-138655035 | PRR23B | 52.55 |
| chr1: 1891320-1891470 | PRKCZ | 62.15 |