SOM cluster: 1168
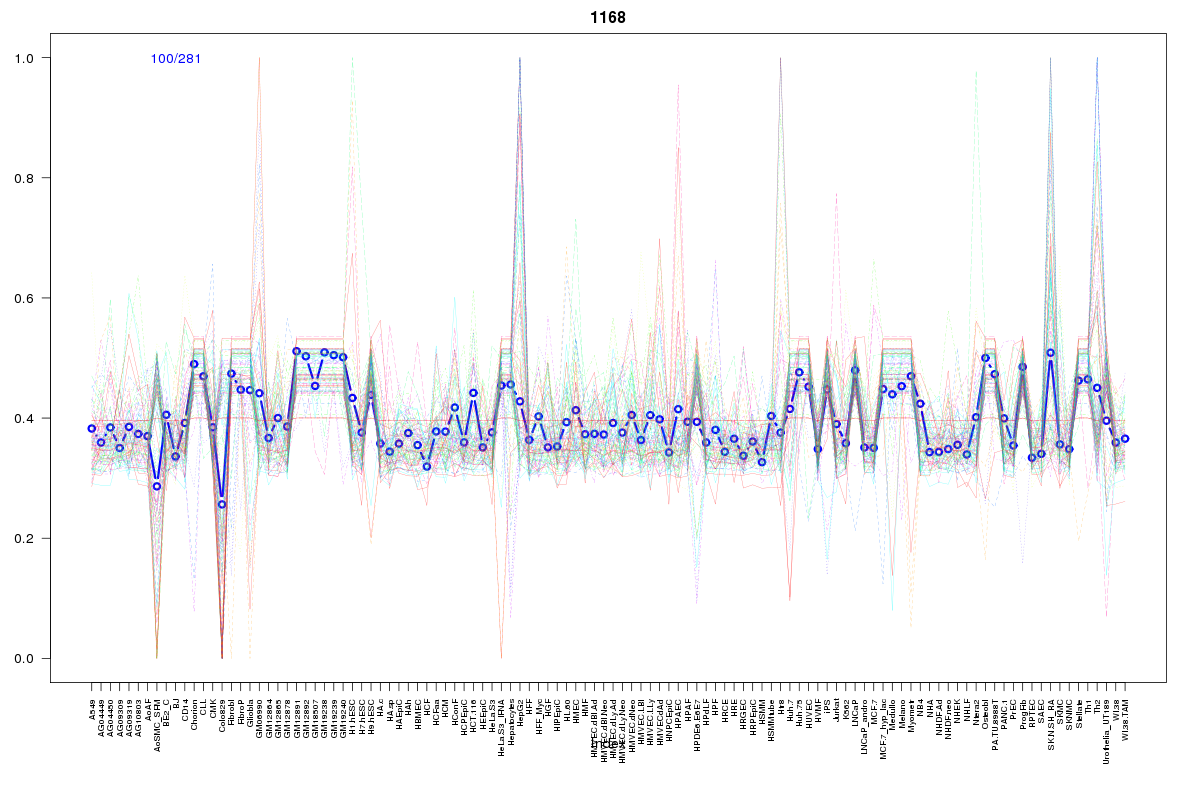
Cluster Hypersensitivity Profile

Genomic Location Trend
These plots show the distribution of the DHS sites surrounding the Transcript Start Site of the nearest gene.
Stats
Number of sites: 281Promoter: 23%
CpG-Island: 50%
Conserved: 42%
Enriched Motifs & Matches
Match Detail: [Jaspar]
|
| ||
|---|---|---|
| Sites: 56/100 | e-val: 2.9e-23 | ||
| Factor | e-val(match) | DB |
| SP1 | 0.0000012307 | JASPAR |
| Klf4 | 0.00087822 | JASPAR |
| TFAP2A | 0.021991 | JASPAR |
| Egr1 | 0.033876 | JASPAR |
| PLAG1 | 0.050747 | JASPAR |
|
| ||
| Sites: 35/100 | e-val: 0.00000092 | ||
| Factor | e-val(match) | DB |
| NHLH1 | 0.001097 | JASPAR |
| Myf | 0.0026911 | JASPAR |
| TFAP2A | 0.013462 | JASPAR |
| CTCF | 0.014453 | JASPAR |
| PLAG1 | 0.018804 | JASPAR |
|
| ||
| Sites: 28/100 | e-val: 0.000024 | ||
| Factor | e-val(match) | DB |
| SP1 | 0.00000031334 | JASPAR |
| INSM1 | 0.000022138 | JASPAR |
| PLAG1 | 0.00039609 | JASPAR |
| Pax4 | 0.0010278 | JASPAR |
| RREB1 | 0.0011647 | JASPAR |
BED file downloads
Top 10 Example Regions
| Location | Gene Link | Dist. |
|---|---|---|
| chr9: 139222145-139222295 | SDCCAG3 | 57.92 |
| chr7: 138719885-138720035 | ZC3HAV1L | 58.15 |
| chr7: 138719885-138720035 | RP11-383F6.1 | 58.15 |
| chr1: 246981185-246981335 | SCCPDH | 58.35 |
| chr17: 3627745-3627895 | EMC6 | 60.55 |
| chr17: 3627745-3627895 | GSG2 | 60.55 |
| chr8: 12294165-12294315 | FAM66A | 63.19 |
| chr17: 17721440-17721590 | SREBF1 | 64.62 |
| chr17: 17721440-17721590 | SMCR5 | 64.62 |
| chr20: 1857605-1857755 | RP4-673D20.3 | 65.02 |