SOM cluster: 1169
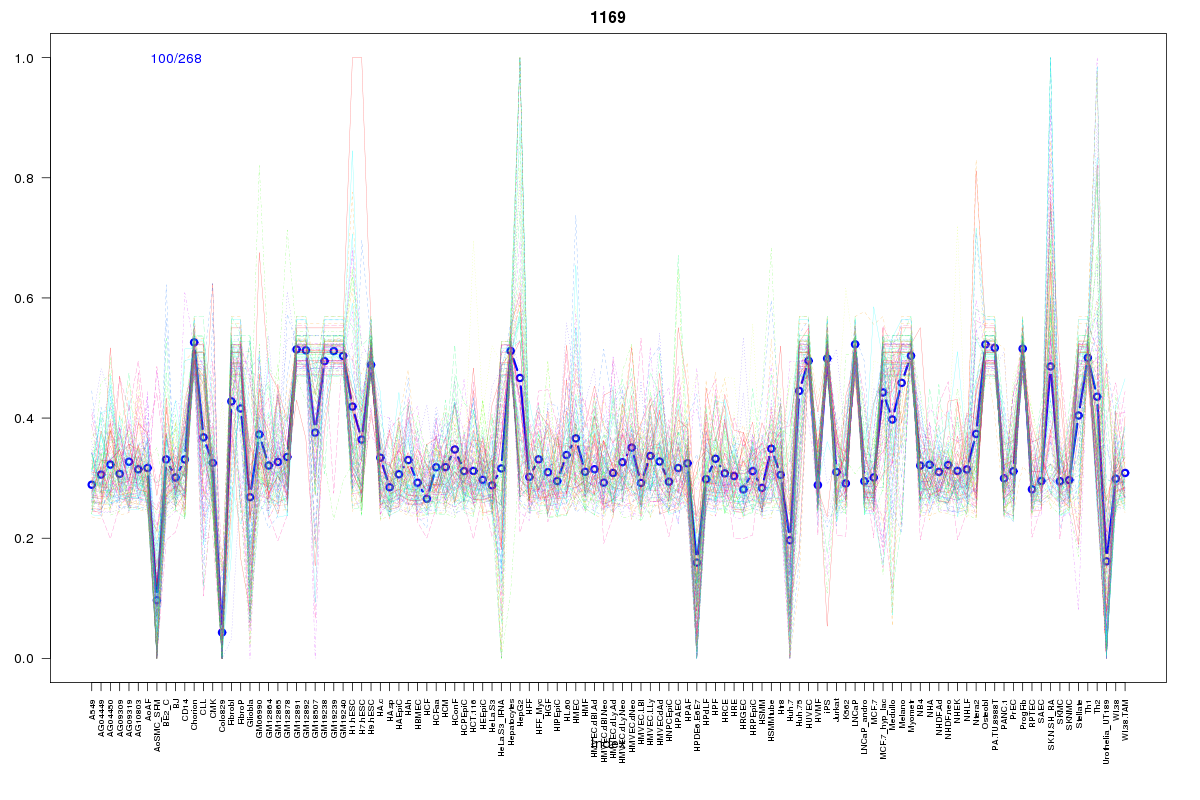
Cluster Hypersensitivity Profile

Genomic Location Trend
These plots show the distribution of the DHS sites surrounding the Transcript Start Site of the nearest gene.
Stats
Number of sites: 268Promoter: 16%
CpG-Island: 35%
Conserved: 38%
Enriched Motifs & Matches
Match Detail: [Jaspar]
|
| ||
|---|---|---|
| Sites: 65/100 | e-val: 1.6e-36 | ||
| Factor | e-val(match) | DB |
| SP1 | 0.000000000080578 | JASPAR |
| Klf4 | 0.00043969 | JASPAR |
| RREB1 | 0.00087277 | JASPAR |
| PLAG1 | 0.0061348 | JASPAR |
| Egr1 | 0.0073934 | JASPAR |
BED file downloads
Top 10 Example Regions
| Location | Gene Link | Dist. |
|---|---|---|
| chr1: 39283425-39283575 | GJA9 | 55.23 |
| chr12: 38444025-38444175 | RP11-297L6.1 | 59.72 |
| chr7: 137601420-137601570 | AC022173.2 | 60.78 |
| chr19: 54158265-54158415 | RN7SL317P | 61.47 |
| chr6: 1312000-1312150 | FOXQ1 | 61.88 |
| chr19: 49562005-49562155 | LHB | 62.13 |
| chr4: 1323705-1323855 | NKX1-1 | 68.27 |
| chr1: 1093925-1094075 | B3GALT6 | 69.31 |
| chr12: 80343425-80343575 | RPL7P38 | 71.66 |
| chr5: 3603045-3603195 | IRX1 | 73.34 |