SOM cluster: 1183
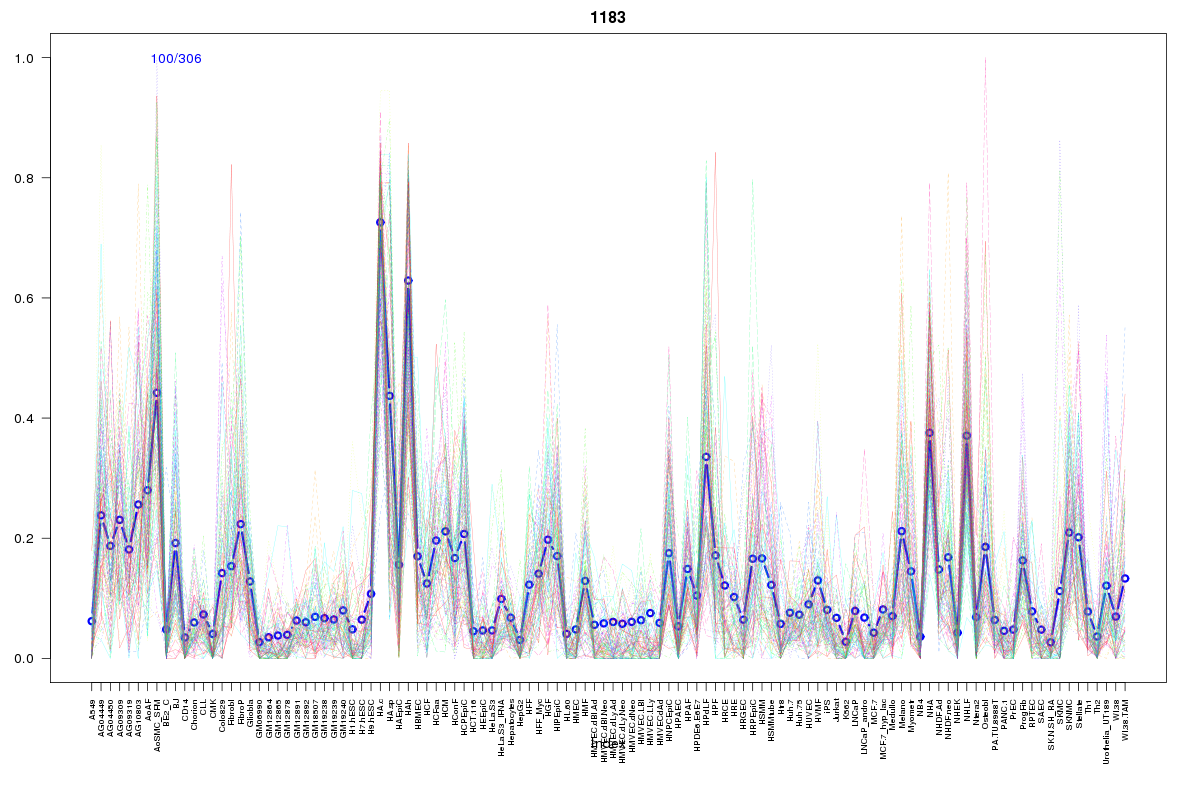
Cluster Hypersensitivity Profile

Genomic Location Trend
These plots show the distribution of the DHS sites surrounding the Transcript Start Site of the nearest gene.
Stats
Number of sites: 306Promoter: 3%
CpG-Island: 0%
Conserved: 43%
Enriched Motifs & Matches
Match Detail: [Jaspar]
|
| ||
|---|---|---|
| Sites: 23/100 | e-val: 0.000000014 | ||
| Factor | e-val(match) | DB |
| Foxd3 | 0.00077082 | JASPAR |
| IRF1 | 0.0027391 | JASPAR |
| FOXF2 | 0.0099588 | JASPAR |
| Foxa2 | 0.010932 | JASPAR |
| Foxq1 | 0.01692 | JASPAR |
|
| ||
| Sites: 14/100 | e-val: 0.16 | ||
| Factor | e-val(match) | DB |
| RUNX1 | 0.0015376 | JASPAR |
| HOXA5 | 0.003089 | JASPAR |
| SRF | 0.0041566 | JASPAR |
| RORA_1 | 0.0060084 | JASPAR |
| NKX3-1 | 0.00663 | JASPAR |
BED file downloads
Top 10 Example Regions
| Location | Gene Link | Dist. |
|---|---|---|
| chr12: 77629980-77630130 | RP1-34H18.1 | 29.96 |
| chr10: 24753985-24754135 | KIAA1217 | 40.24 |
| chr16: 50836020-50836170 | NOD2 | 60.38 |
| chr8: 98929020-98929170 | MATN2 | 65.92 |
| chr11: 33756280-33756430 | RP11-646J21.2 | 66.69 |
| chr11: 33756280-33756430 | RP11-646J21.5 | 66.69 |
| chr11: 76320920-76321070 | GUCY2EP | 70.15 |
| chr8: 94859200-94859350 | PDP1 | 70.66 |
| chr19: 14133280-14133430 | DCAF15 | 72.32 |
| chr19: 14133280-14133430 | ASF1B | 72.32 |