SOM cluster: 120
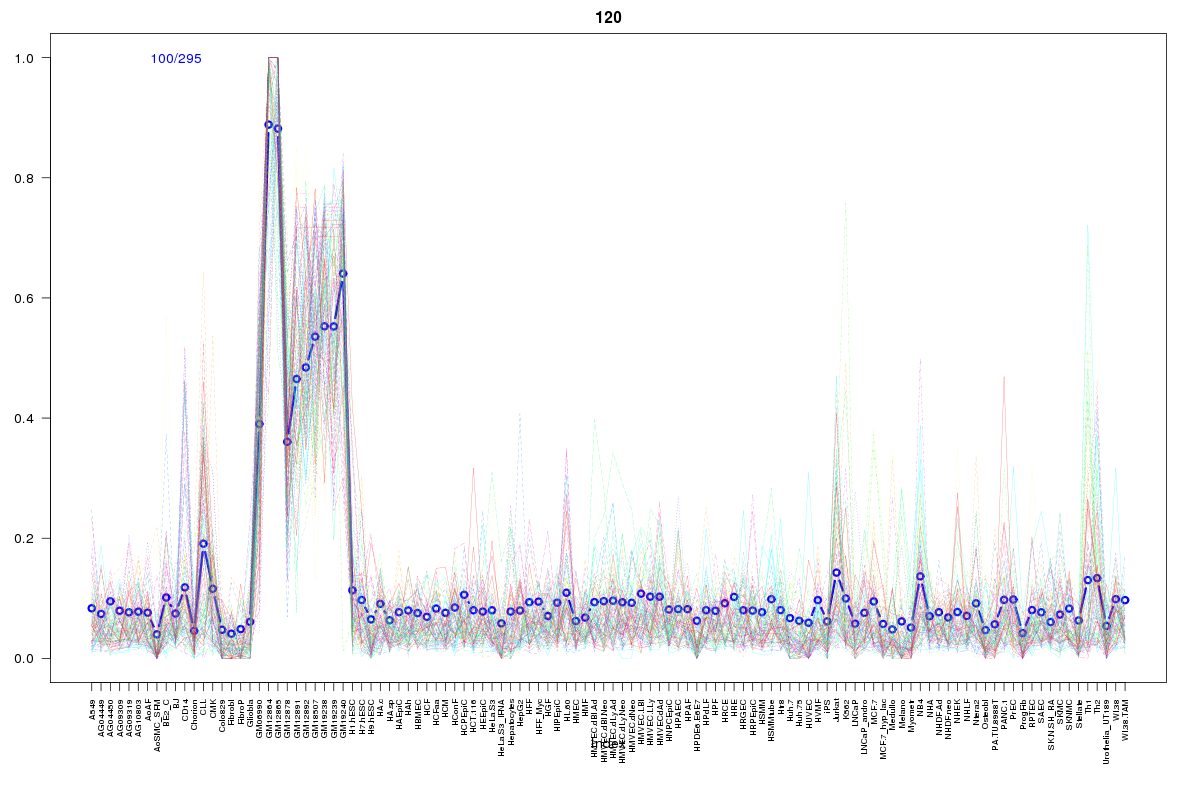
Cluster Hypersensitivity Profile

Genomic Location Trend
These plots show the distribution of the DHS sites surrounding the Transcript Start Site of the nearest gene.
Stats
Number of sites: 295Promoter: 4%
CpG-Island: 0%
Conserved: 27%
Enriched Motifs & Matches
Match Detail: [Jaspar]
|
| ||
|---|---|---|
| Sites: 44/100 | e-val: 0.00000000000086 | ||
| Factor | e-val(match) | DB |
| IRF1 | 0.0000010474 | JASPAR |
| IRF2 | 0.00041302 | JASPAR |
| SPIB | 0.013541 | JASPAR |
| ELK4 | 0.037539 | JASPAR |
| FEV | 0.049295 | JASPAR |
BED file downloads
Top 10 Example Regions
| Location | Gene Link | Dist. |
|---|---|---|
| chr1: 150743500-150743650 | CTSS | 29.12 |
| chr7: 45200140-45200290 | RAMP3 | 51.31 |
| chr22: 41738085-41738235 | TEF | 59.05 |
| chr11: 126273640-126273790 | DCPS | 59.24 |
| chr11: 126273640-126273790 | ST3GAL4 | 59.24 |
| chr11: 126273640-126273790 | KIRREL3 | 59.24 |
| chr9: 139582825-139582975 | EGFL7 | 61.92 |
| chr12: 6948965-6949115 | CDCA3 | 62.25 |
| chr12: 6948965-6949115 | ENO2 | 62.25 |
| chr12: 6948965-6949115 | LEPREL2 | 62.25 |