SOM cluster: 1206
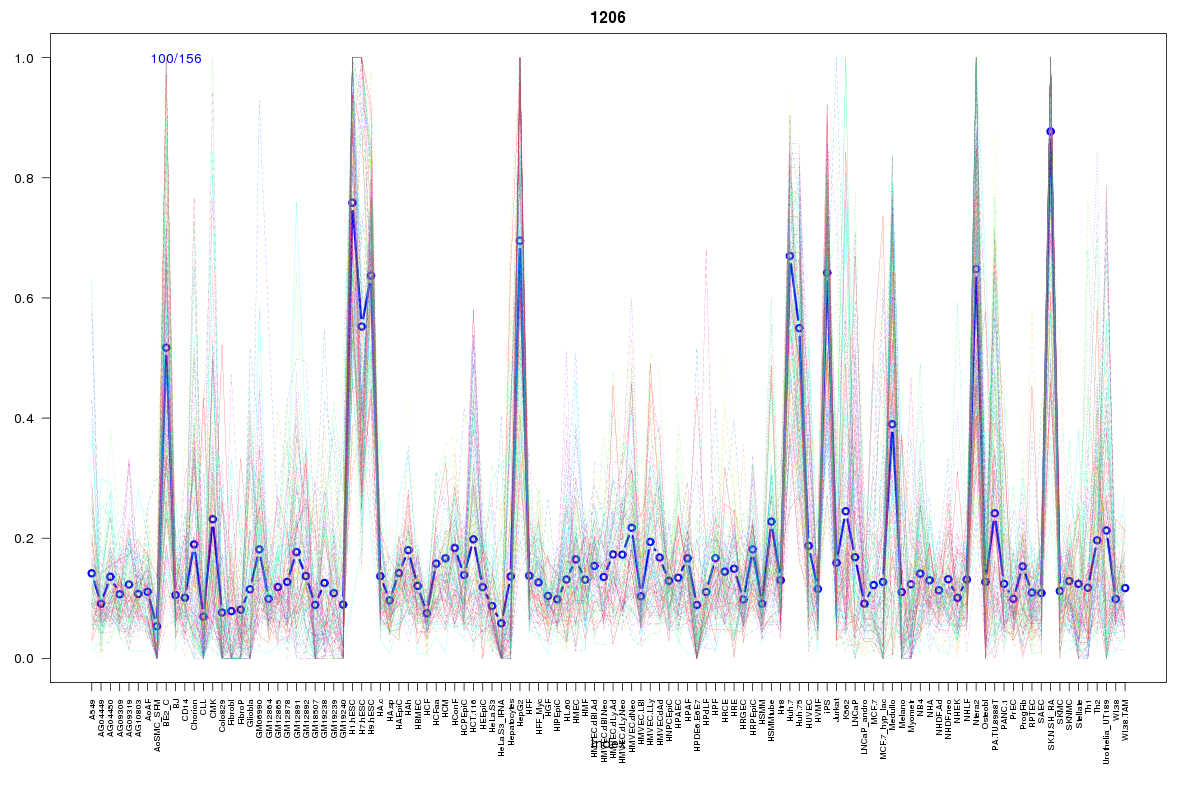
Cluster Hypersensitivity Profile

Genomic Location Trend
These plots show the distribution of the DHS sites surrounding the Transcript Start Site of the nearest gene.
Stats
Number of sites: 156Promoter: 29%
CpG-Island: 58%
Conserved: 58%
Enriched Motifs & Matches
Match Detail: [Jaspar]
|
| ||
|---|---|---|
| Sites: 91/100 | e-val: 0 | ||
| Factor | e-val(match) | DB |
| SP1 | 0.0000000010614 | JASPAR |
| Egr1 | 0.000075453 | JASPAR |
| Klf4 | 0.00020753 | JASPAR |
| TFAP2A | 0.0012091 | JASPAR |
| PLAG1 | 0.0053366 | JASPAR |
|
| ||
| Sites: 66/100 | e-val: 6e-24 | ||
| Factor | e-val(match) | DB |
| SP1 | 0.0000063163 | JASPAR |
| TFAP2A | 0.0015334 | JASPAR |
| PLAG1 | 0.0031857 | JASPAR |
| Egr1 | 0.011979 | JASPAR |
| Tal1::Gata1 | 0.017623 | JASPAR |
|
| ||
| Sites: 40/100 | e-val: 0.000013 | ||
| Factor | e-val(match) | DB |
| SP1 | 0.000011344 | JASPAR |
| TFAP2A | 0.00021032 | JASPAR |
| PLAG1 | 0.0060281 | JASPAR |
| MZF1_1-4 | 0.0075823 | JASPAR |
| Klf4 | 0.0089984 | JASPAR |
BED file downloads
Top 10 Example Regions
| Location | Gene Link | Dist. |
|---|---|---|
| chr16: 87635680-87635830 | JPH3 | 46.77 |
| chr16: 87635680-87635830 | FLJ00104 | 46.77 |
| chr1: 214156400-214156550 | PROX1 | 56.26 |
| chr1: 214156400-214156550 | PROX1-AS1 | 56.26 |
| chr3: 139258460-139258610 | RBP1 | 59.91 |
| chr11: 22214440-22214590 | ANO5 | 65.12 |
| chr3: 125965320-125965470 | KLF15 | 65.68 |
| chr15: 78912360-78912510 | CHRNA3 | 67.79 |
| chr15: 78912360-78912510 | CHRNA5 | 67.79 |
| chr2: 154728180-154728330 | GALNT13 | 74.55 |