SOM cluster: 1214
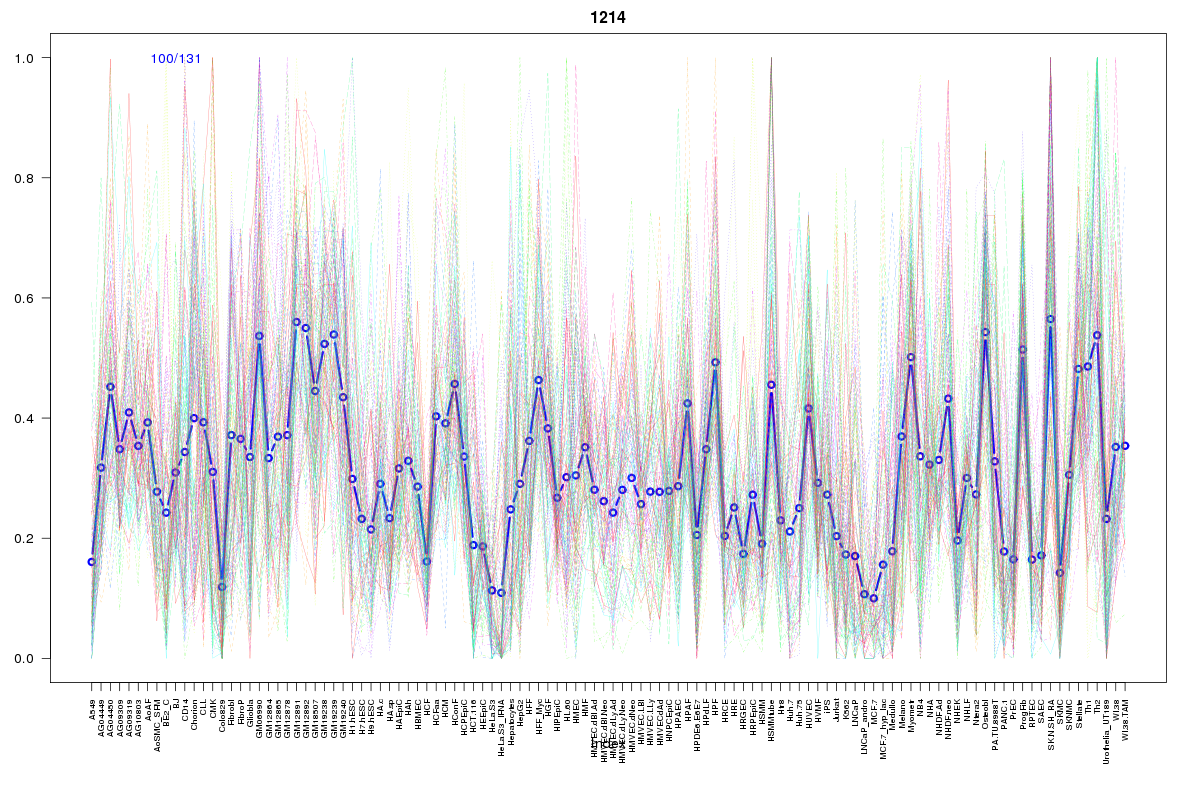
Cluster Hypersensitivity Profile

Genomic Location Trend
These plots show the distribution of the DHS sites surrounding the Transcript Start Site of the nearest gene.
Stats
Number of sites: 131Promoter: 23%
CpG-Island: 74%
Conserved: 70%
Enriched Motifs & Matches
Match Detail: [Jaspar]
|
| ||
|---|---|---|
| Sites: 88/100 | e-val: 0 | ||
| Factor | e-val(match) | DB |
| SP1 | 0.0000000082358 | JASPAR |
| PLAG1 | 0.0012357 | JASPAR |
| Klf4 | 0.0017052 | JASPAR |
| TFAP2A | 0.0050713 | JASPAR |
| Egr1 | 0.0069745 | JASPAR |
|
| ||
| Sites: 89/100 | e-val: 0.000000054 | ||
| Factor | e-val(match) | DB |
| SP1 | 0.000041592 | JASPAR |
| TFAP2A | 0.0022912 | JASPAR |
| Pax4 | 0.018229 | JASPAR |
| Egr1 | 0.024018 | JASPAR |
| Tal1::Gata1 | 0.025497 | JASPAR |
BED file downloads
Top 10 Example Regions
| Location | Gene Link | Dist. |
|---|---|---|
| chr2: 75426720-75426870 | TACR1 | 43.34 |
| chr6: 10426445-10426595 | RP11-360O19.4 | 45.24 |
| chr6: 10426445-10426595 | TFAP2A-AS1 | 45.24 |
| chr14: 59104300-59104450 | DACT1 | 59.06 |
| chr10: 28031385-28031535 | MKX | 59.76 |
| chr1: 6663640-6663790 | PHF13 | 64.03 |
| chr19: 18415940-18416090 | RN7SL513P | 64.66 |
| chr3: 36985520-36985670 | TRANK1 | 64.82 |
| chr16: 56905280-56905430 | HERPUD1 | 66.59 |
| chr12: 121107080-121107230 | CABP1 | 68.86 |