SOM cluster: 1216
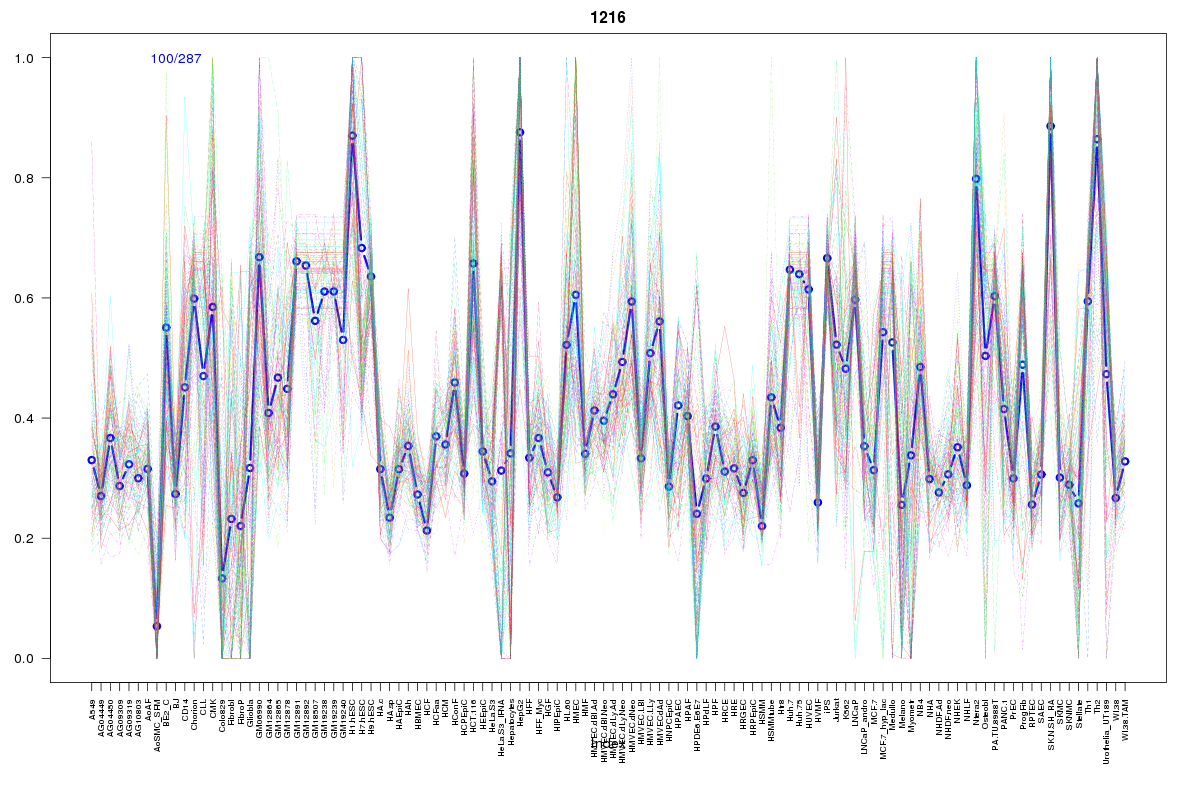
Cluster Hypersensitivity Profile

Genomic Location Trend
These plots show the distribution of the DHS sites surrounding the Transcript Start Site of the nearest gene.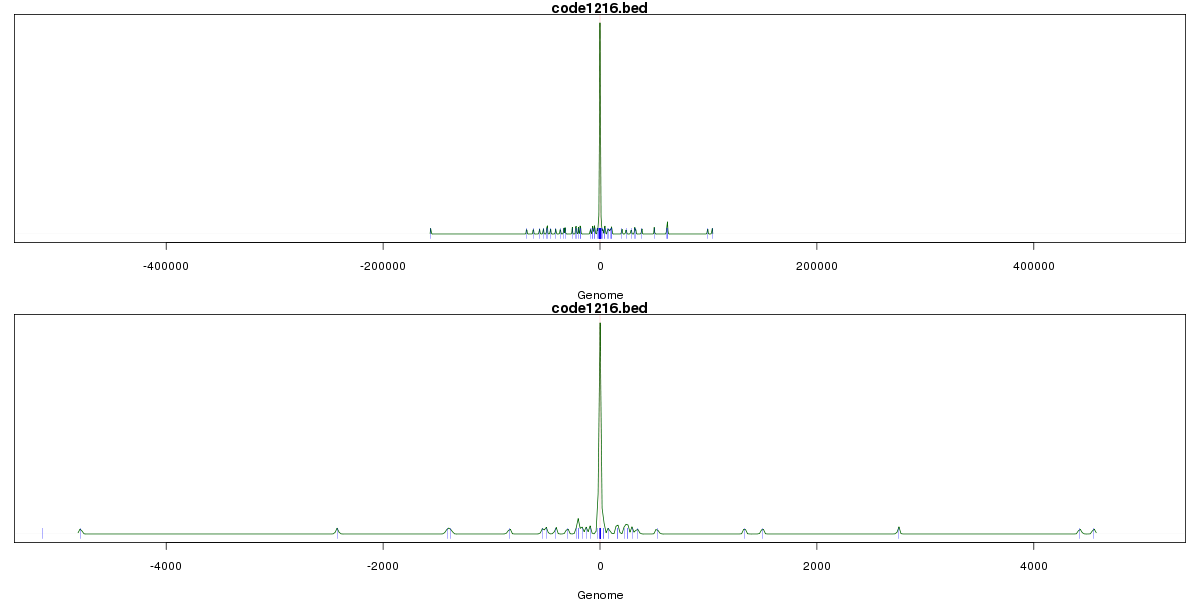
Stats
Number of sites: 287Promoter: 43%
CpG-Island: 77%
Conserved: 79%
Enriched Motifs & Matches
Match Detail: [Jaspar]
|
| ||
|---|---|---|
| Sites: 92/100 | e-val: 0 | ||
| Factor | e-val(match) | DB |
| CTCF | 0.00000037262 | JASPAR |
| SP1 | 0.0000018338 | JASPAR |
| INSM1 | 0.00011514 | JASPAR |
| Egr1 | 0.00069916 | JASPAR |
| TFAP2A | 0.0019401 | JASPAR |
|
| ||
| Sites: 86/100 | e-val: 0 | ||
| Factor | e-val(match) | DB |
| SP1 | 0.000000013316 | JASPAR |
| Klf4 | 0.00011037 | JASPAR |
| TFAP2A | 0.00020185 | JASPAR |
| Zfx | 0.0032171 | JASPAR |
| Pax4 | 0.027001 | JASPAR |
|
| ||
| Sites: 45/100 | e-val: 0.0000000001 | ||
| Factor | e-val(match) | DB |
| SP1 | 0.000075199 | JASPAR |
| Myf | 0.0040245 | JASPAR |
| PLAG1 | 0.02331 | JASPAR |
| INSM1 | 0.024019 | JASPAR |
| TFAP2A | 0.033452 | JASPAR |
|
| ||
| Sites: 35/100 | e-val: 0.11 | ||
| Factor | e-val(match) | DB |
| TFAP2A | 0.0012881 | JASPAR |
| SP1 | 0.001303 | JASPAR |
| INSM1 | 0.0028241 | JASPAR |
| NHLH1 | 0.0070196 | JASPAR |
| PLAG1 | 0.01267 | JASPAR |
BED file downloads
Top 10 Example Regions
| Location | Gene Link | Dist. |
|---|---|---|
| chr3: 32280060-32280210 | CMTM8 | 39.85 |
| chr9: 133814585-133814735 | QRFP | 43.18 |
| chr5: 176514000-176514150 | FGFR4 | 45.7 |
| chr8: 144490200-144490350 | RNU6-220P | 48.61 |
| chr3: 39093860-39094010 | GORASP1 | 48.7 |
| chr1: 45251805-45251955 | KIF2C | 50.39 |
| chr1: 45251805-45251955 | TCTEX1D4 | 50.39 |
| chr1: 45251805-45251955 | RNU5E-6P | 50.39 |
| chr1: 45251805-45251955 | RPS8 | 50.39 |
| chr1: 45251805-45251955 | BTBD19 | 50.39 |