SOM cluster: 1219
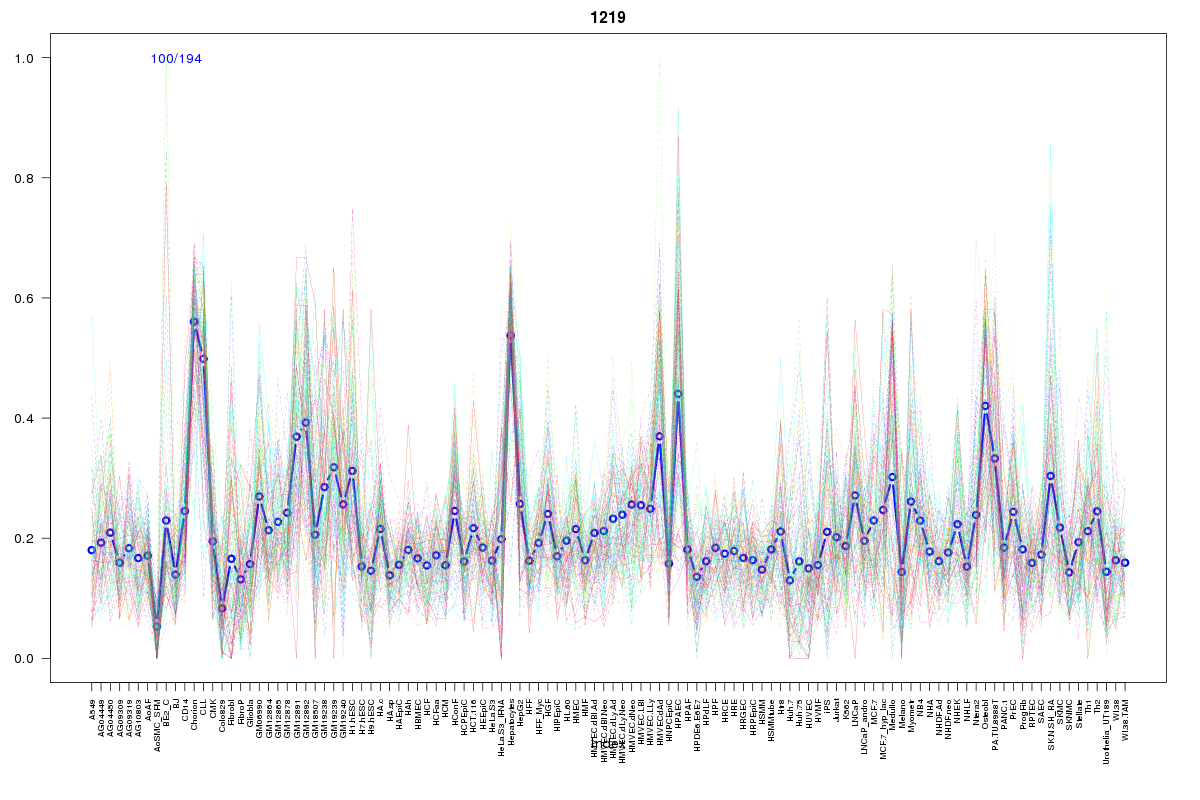
Cluster Hypersensitivity Profile

Genomic Location Trend
These plots show the distribution of the DHS sites surrounding the Transcript Start Site of the nearest gene.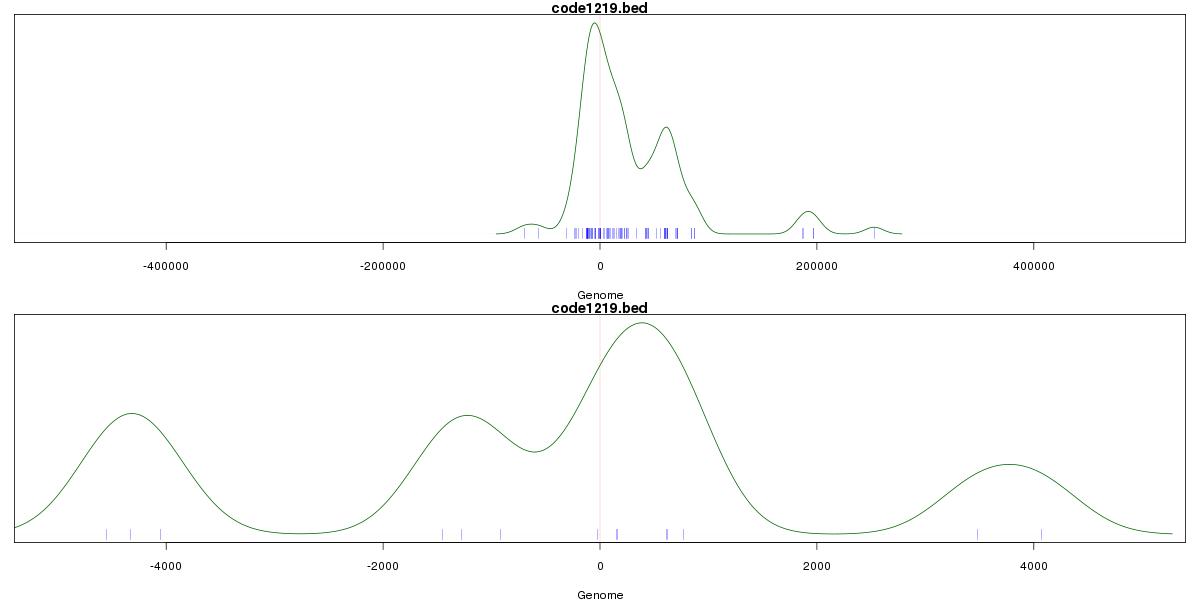
Stats
Number of sites: 194Promoter: 5%
CpG-Island: 9%
Conserved: 22%
Enriched Motifs & Matches
Match Detail: [Jaspar]
|
| ||
|---|---|---|
| Sites: 58/100 | e-val: 0.000000000000013 | ||
| Factor | e-val(match) | DB |
| RREB1 | 0.0000002142 | JASPAR |
| Pax4 | 0.0000014461 | JASPAR |
| SP1 | 0.0000018439 | JASPAR |
| REST | 0.0038326 | JASPAR |
| Tal1::Gata1 | 0.0040954 | JASPAR |
|
| ||
| Sites: 7/100 | e-val: 0.77 | ||
| Factor | e-val(match) | DB |
| ZEB1 | 0.00085906 | JASPAR |
| T | 0.001083 | JASPAR |
| Myf | 0.014332 | JASPAR |
| FOXO3 | 0.014773 | JASPAR |
| NR1H2::RXRA | 0.018047 | JASPAR |
|
| ||
| Sites: 16/100 | e-val: 0.0027 | ||
| Factor | e-val(match) | DB |
| Myf | 0.010068 | JASPAR |
| EWSR1-FLI1 | 0.019171 | JASPAR |
| NHLH1 | 0.019708 | JASPAR |
| Hand1::Tcfe2a | 0.021464 | JASPAR |
| TLX1::NFIC | 0.031683 | JASPAR |
BED file downloads
Top 10 Example Regions
| Location | Gene Link | Dist. |
|---|---|---|
| chr11: 1213360-1213510 | RP11-532E4.2 | 58.73 |
| chr19: 1455160-1455310 | AC005329.7 | 69.63 |
| chr19: 1455160-1455310 | ADAMTSL5 | 69.63 |
| chr13: 41241240-41241390 | FOXO1 | 74.49 |
| chr22: 39573805-39573955 | PDGFB | 76.4 |
| chr21: 43640200-43640350 | ABCG1 | 79.87 |
| chr8: 58116705-58116855 | RP11-513O17.1 | 89.44 |
| chr1: 1005425-1005575 | RNF223 | 90.77 |
| chr1: 1005425-1005575 | ISG15 | 90.77 |
| chr1: 1005425-1005575 | MIR200A | 90.77 |