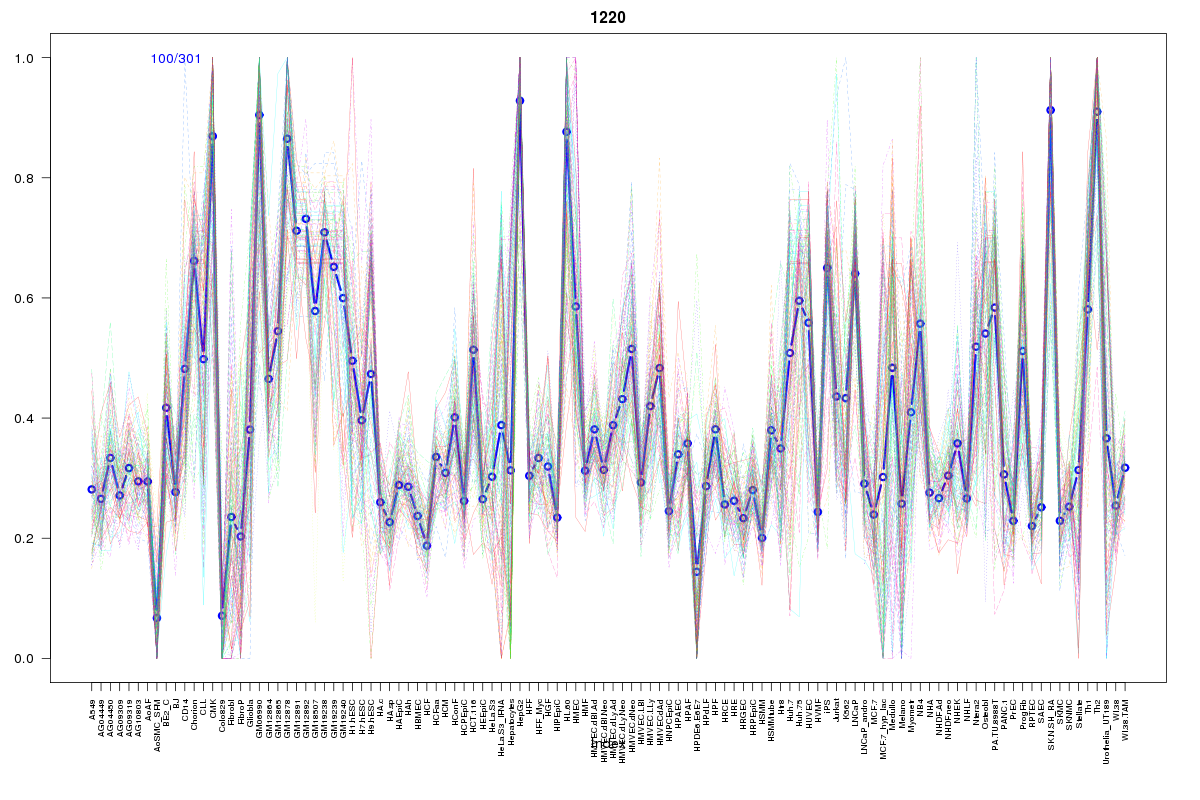
SOM cluster: 1220
Cluster Hypersensitivity Profile

Genomic Location Trend
These plots show the distribution of the DHS sites surrounding the Transcript Start Site of the nearest gene.
Stats
Number of sites: 301Promoter: 44%
CpG-Island: 93%
Conserved: 67%
Enriched Motifs & Matches
Match Detail: [Jaspar]
|
| ||
|---|---|---|
| Sites: 97/100 | e-val: 0 | ||
| Factor | e-val(match) | DB |
| SP1 | 0.00000039871 | JASPAR |
| TFAP2A | 0.00028763 | JASPAR |
| Egr1 | 0.00276 | JASPAR |
| Klf4 | 0.0064845 | JASPAR |
| Zfx | 0.017534 | JASPAR |
|
| ||
| Sites: 94/100 | e-val: 0 | ||
| Factor | e-val(match) | DB |
| SP1 | 0.000000020883 | JASPAR |
| Klf4 | 0.0012193 | JASPAR |
| TFAP2A | 0.0028834 | JASPAR |
| PLAG1 | 0.003948 | JASPAR |
| Pax4 | 0.024806 | JASPAR |
|
| ||
| Sites: 56/100 | e-val: 0.000000025 | ||
| Factor | e-val(match) | DB |
| TFAP2A | 0.00044091 | JASPAR |
| PLAG1 | 0.0020738 | JASPAR |
| NHLH1 | 0.0049689 | JASPAR |
| SP1 | 0.024429 | JASPAR |
| Zfx | 0.078523 | JASPAR |
|
| ||
| Sites: 45/100 | e-val: 0.00083 | ||
| Factor | e-val(match) | DB |
| SP1 | 0.0000000006165 | JASPAR |
| Egr1 | 0.000011905 | JASPAR |
| Klf4 | 0.00021603 | JASPAR |
| TFAP2A | 0.0026281 | JASPAR |
| Zfx | 0.0028256 | JASPAR |
BED file downloads
Top 10 Example Regions
| Location | Gene Link | Dist. |
|---|---|---|
| chr19: 30433540-30433690 | URI1 | 36.25 |
| chr1: 1093600-1093750 | MIR429 | 37.5 |
| chr1: 1093600-1093750 | RP11-465B22.5 | 37.5 |
| chr11: 66611040-66611190 | RCE1 | 43.62 |
| chr11: 65625340-65625490 | DRAP1 | 47.82 |
| chr11: 65625340-65625490 | EFEMP2 | 47.82 |
| chr11: 65625340-65625490 | MUS81 | 47.82 |
| chr11: 65625340-65625490 | SNX32 | 47.82 |
| chr11: 65625340-65625490 | FIBP | 47.82 |
| chr22: 36902825-36902975 | RP5-1119A7.14 | 50.72 |