SOM cluster: 1222
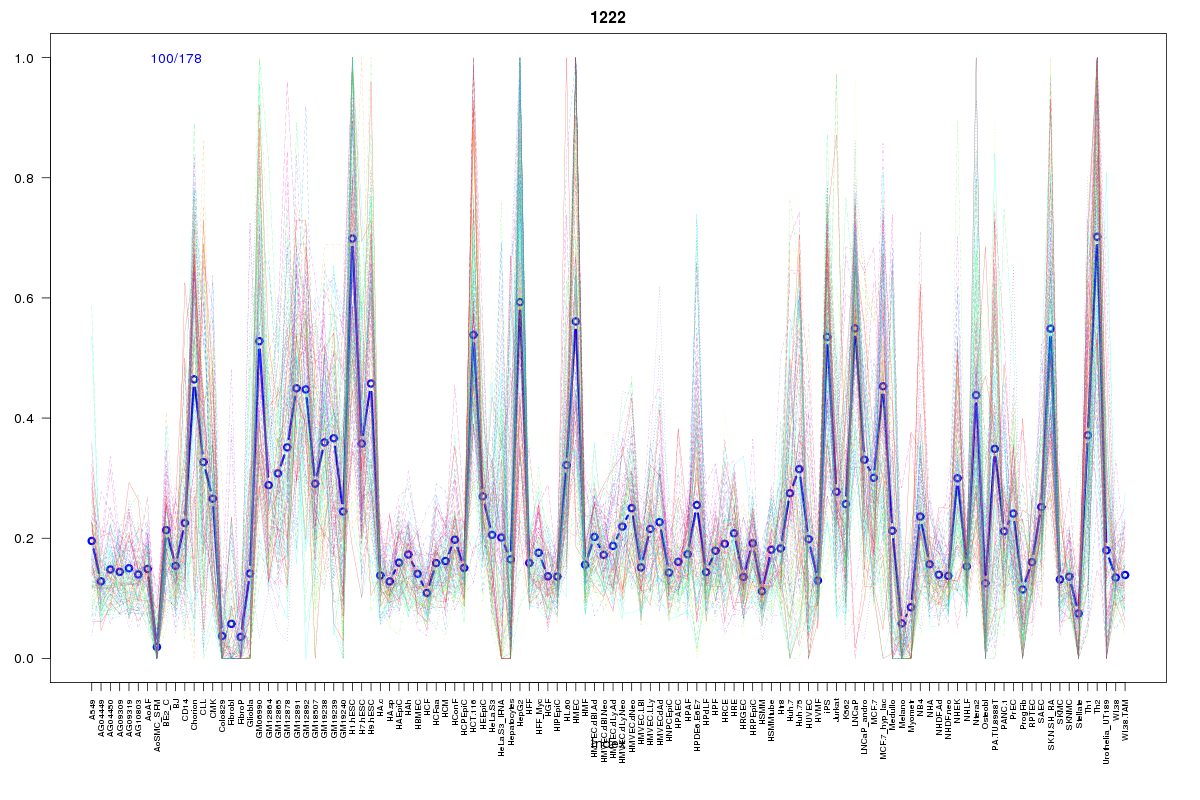
Cluster Hypersensitivity Profile

Genomic Location Trend
These plots show the distribution of the DHS sites surrounding the Transcript Start Site of the nearest gene.
Stats
Number of sites: 178Promoter: 38%
CpG-Island: 88%
Conserved: 66%
Enriched Motifs & Matches
Match Detail: [Jaspar]
|
| ||
|---|---|---|
| Sites: 95/100 | e-val: 0 | ||
| Factor | e-val(match) | DB |
| SP1 | 0.000000015678 | JASPAR |
| Klf4 | 0.000021668 | JASPAR |
| Egr1 | 0.00047431 | JASPAR |
| TFAP2A | 0.0014555 | JASPAR |
| PLAG1 | 0.0019074 | JASPAR |
|
| ||
| Sites: 92/100 | e-val: 7.9e-40 | ||
| Factor | e-val(match) | DB |
| NHLH1 | 0.000027605 | JASPAR |
| Myf | 0.0003131 | JASPAR |
| TFAP2A | 0.00035843 | JASPAR |
| TP53 | 0.029793 | JASPAR |
| MYC::MAX | 0.055224 | JASPAR |
BED file downloads
Top 10 Example Regions
| Location | Gene Link | Dist. |
|---|---|---|
| chr12: 48298640-48298790 | TMEM106C | 49.92 |
| chr8: 104311325-104311475 | BAALC | 51.21 |
| chr8: 104311325-104311475 | CTHRC1 | 51.21 |
| chr19: 10679200-10679350 | KRI1 | 55.82 |
| chr19: 10679200-10679350 | ILF3 | 55.82 |
| chr19: 10679200-10679350 | ATG4D | 55.82 |
| chr19: 10679200-10679350 | KEAP1 | 55.82 |
| chr1: 1004125-1004275 | MIR200A | 56.36 |
| chr17: 26578520-26578670 | IFT20 | 58.45 |
| chr1: 1141925-1142075 | RP11-465B22.5 | 60.04 |