SOM cluster: 1227
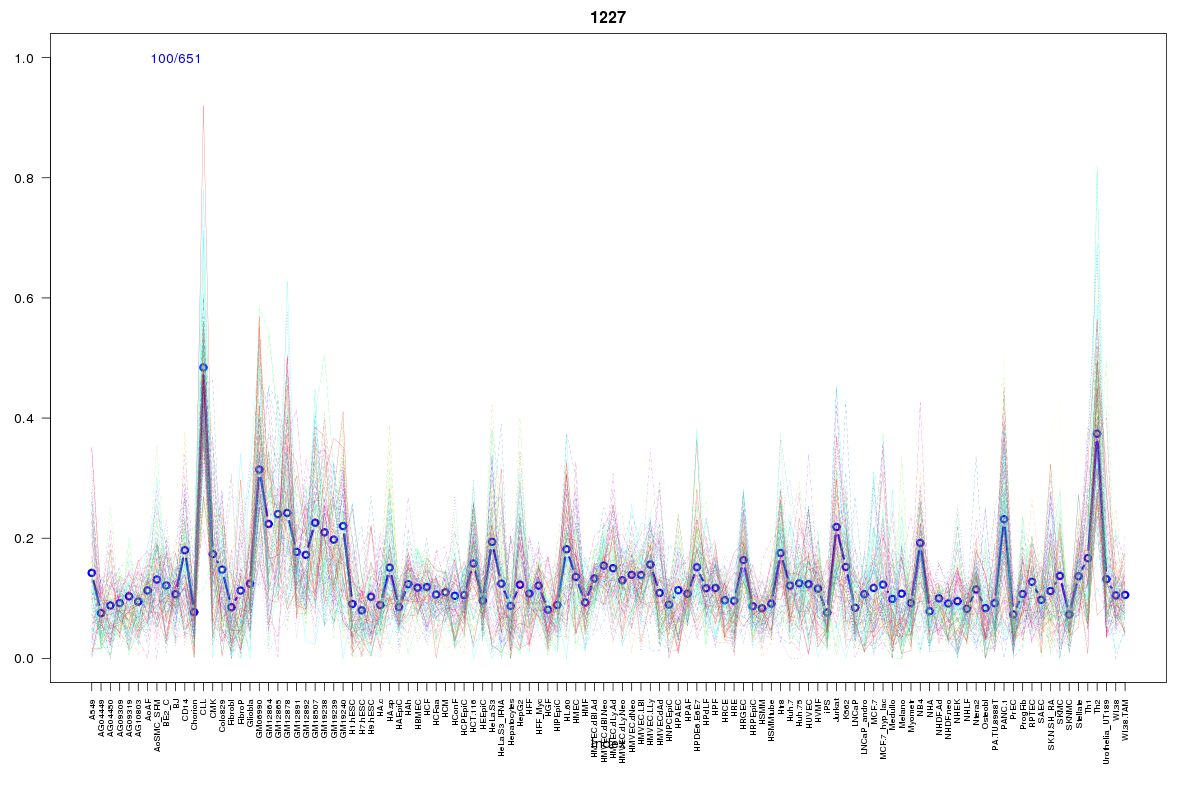
Cluster Hypersensitivity Profile

Genomic Location Trend
These plots show the distribution of the DHS sites surrounding the Transcript Start Site of the nearest gene.
Stats
Number of sites: 651Promoter: 40%
CpG-Island: 15%
Conserved: 28%
Enriched Motifs & Matches
Match Detail: [Jaspar]
|
| ||
|---|---|---|
| Sites: 25/100 | e-val: 0.0000061 | ||
| Factor | e-val(match) | DB |
| IRF1 | 0.0000092506 | JASPAR |
| NFATC2 | 0.00024713 | JASPAR |
| IRF2 | 0.003007 | JASPAR |
| NFE2L2 | 0.0047099 | JASPAR |
| Pou5f1 | 0.0095349 | JASPAR |
|
| ||
| Sites: 18/100 | e-val: 0.45 | ||
| Factor | e-val(match) | DB |
| Pax4 | 0.000000018278 | JASPAR |
| RREB1 | 0.0000014447 | JASPAR |
| Klf4 | 0.0000021889 | JASPAR |
| SP1 | 0.00024363 | JASPAR |
| Ar | 0.00028926 | JASPAR |
BED file downloads
Top 10 Example Regions
| Location | Gene Link | Dist. |
|---|---|---|
| chr1: 145427765-145427915 | RNVU1-6 | 13.82 |
| chr1: 145427765-145427915 | GNRHR2 | 13.82 |
| chr1: 145427765-145427915 | POLR3GL | 13.82 |
| chr1: 145427765-145427915 | RP11-315I20.1 | 13.82 |
| chr1: 145427765-145427915 | RBM8A | 13.82 |
| chr1: 151320140-151320290 | POGZ | 21.23 |
| chr1: 151320140-151320290 | ZNF687 | 21.23 |
| chr1: 151320140-151320290 | PSMD4 | 21.23 |
| chr1: 151320140-151320290 | RFX5 | 21.23 |
| chr1: 151320140-151320290 | PSMB4 | 21.23 |