SOM cluster: 1238
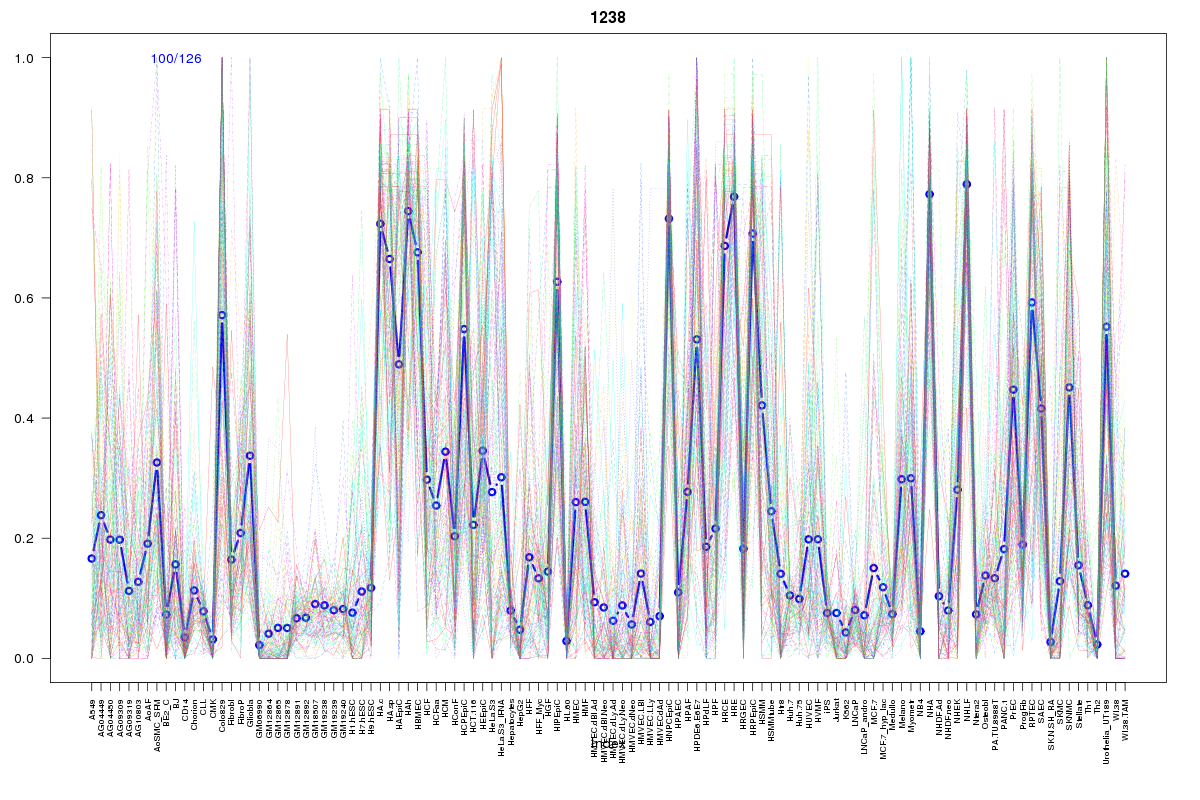
Cluster Hypersensitivity Profile

Genomic Location Trend
These plots show the distribution of the DHS sites surrounding the Transcript Start Site of the nearest gene.
Stats
Number of sites: 126Promoter: 0%
CpG-Island: 0%
Conserved: 38%
Enriched Motifs & Matches
Match Detail: [Jaspar]
|
| ||
|---|---|---|
| Sites: 47/100 | e-val: 1.1e-21 | ||
| Factor | e-val(match) | DB |
| AP1 | 0.00000012636 | JASPAR |
| Lhx3 | 0.0000095171 | JASPAR |
| HOXA5 | 0.00029785 | JASPAR |
| NFE2L2 | 0.0011327 | JASPAR |
| HNF1A | 0.0038737 | JASPAR |
|
| ||
| Sites: 33/100 | e-val: 0.0000099 | ||
| Factor | e-val(match) | DB |
| RUNX1 | 0.00000081157 | JASPAR |
| RREB1 | 0.00047968 | JASPAR |
| ZNF354C | 0.0014242 | JASPAR |
| Tcfcp2l1 | 0.012327 | JASPAR |
| MYC::MAX | 0.014412 | JASPAR |
BED file downloads
Top 10 Example Regions
| Location | Gene Link | Dist. |
|---|---|---|
| chr14: 34086500-34086650 | NPAS3 | 48.41 |
| chr12: 86217680-86217830 | RASSF9 | 52.85 |
| chr15: 96812280-96812430 | NR2F2 | 53.05 |
| chr8: 131893140-131893290 | RP11-737F9.1 | 54.66 |
| chr7: 101524560-101524710 | CUX1 | 56.65 |
| chr8: 39717360-39717510 | KB-1582A10.1 | 63.28 |
| chr3: 177494660-177494810 | RP11-91K9.1 | 64.08 |
| chr9: 109801960-109802110 | ZNF462 | 68.6 |
| chr2: 16804380-16804530 | FAM49A | 74.15 |
| chr4: 166361840-166361990 | MSMO1 | 74.41 |