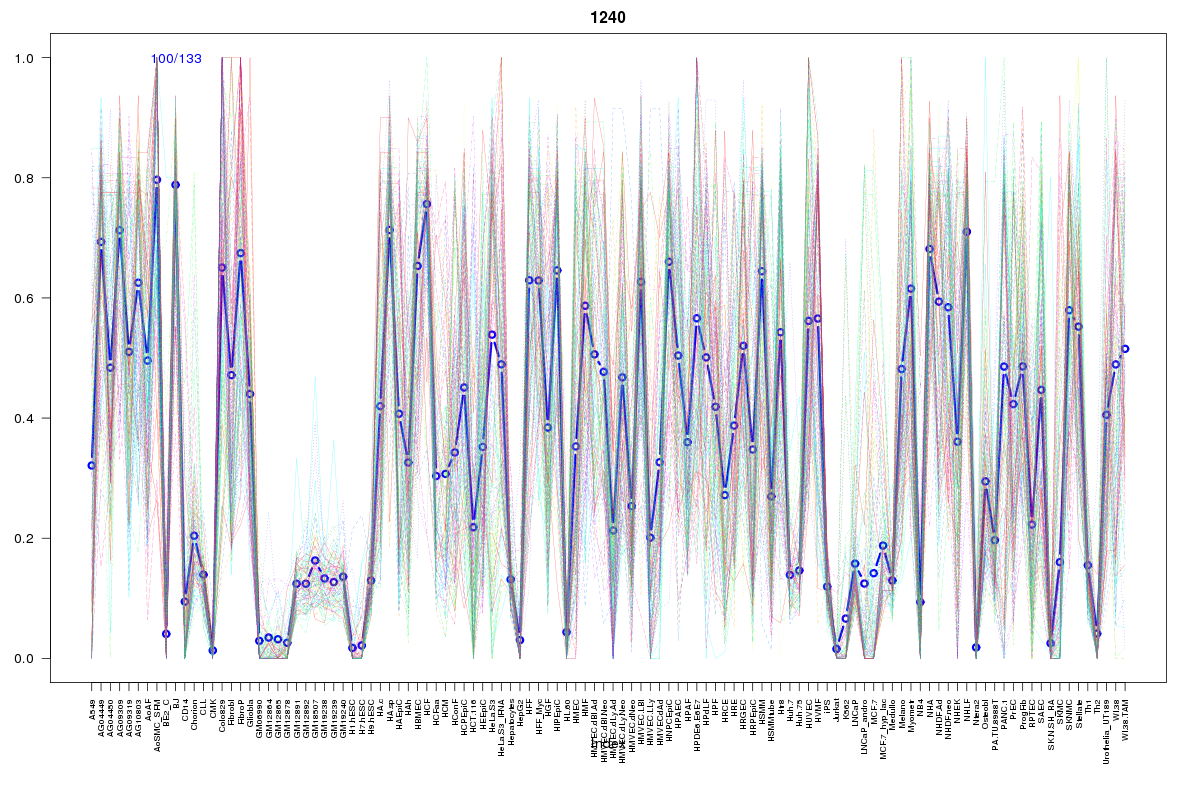
SOM cluster: 1240
Cluster Hypersensitivity Profile

Genomic Location Trend
These plots show the distribution of the DHS sites surrounding the Transcript Start Site of the nearest gene.
Stats
Number of sites: 133Promoter: 2%
CpG-Island: 0%
Conserved: 50%
Enriched Motifs & Matches
Match Detail: [Jaspar]
|
| ||
|---|---|---|
| Sites: 56/100 | e-val: 1.3e-37 | ||
| Factor | e-val(match) | DB |
| AP1 | 0.000000066488 | JASPAR |
| NFE2L2 | 0.000037427 | JASPAR |
| NFE2L1::MafG | 0.0013241 | JASPAR |
| IRF1 | 0.017124 | JASPAR |
| NFATC2 | 0.018334 | JASPAR |
|
| ||
| Sites: 28/100 | e-val: 0.061 | ||
| Factor | e-val(match) | DB |
| Lhx3 | 0.0000010071 | JASPAR |
| Foxq1 | 0.0000066149 | JASPAR |
| HNF1A | 0.0001613 | JASPAR |
| Foxd3 | 0.00038598 | JASPAR |
| MEF2A | 0.00097318 | JASPAR |
BED file downloads
Top 10 Example Regions
| Location | Gene Link | Dist. |
|---|---|---|
| chr12: 109116900-109117050 | CORO1C | 48.87 |
| chr12: 109116900-109117050 | RP11-689B22.2 | 48.87 |
| chr12: 109116900-109117050 | SSH1 | 48.87 |
| chr7: 16169160-16169310 | ISPD-AS1 | 53.41 |
| chr7: 16169160-16169310 | RPL36AP29 | 53.41 |
| chr1: 218654080-218654230 | TGFB2 | 54.08 |
| chr2: 160838900-160839050 | PLA2R1 | 57.33 |
| chr11: 104917760-104917910 | CARD16 | 58.96 |
| chr11: 104917760-104917910 | CASP1P2 | 58.96 |
| chr11: 104917760-104917910 | CARD17 | 58.96 |