SOM cluster: 1247
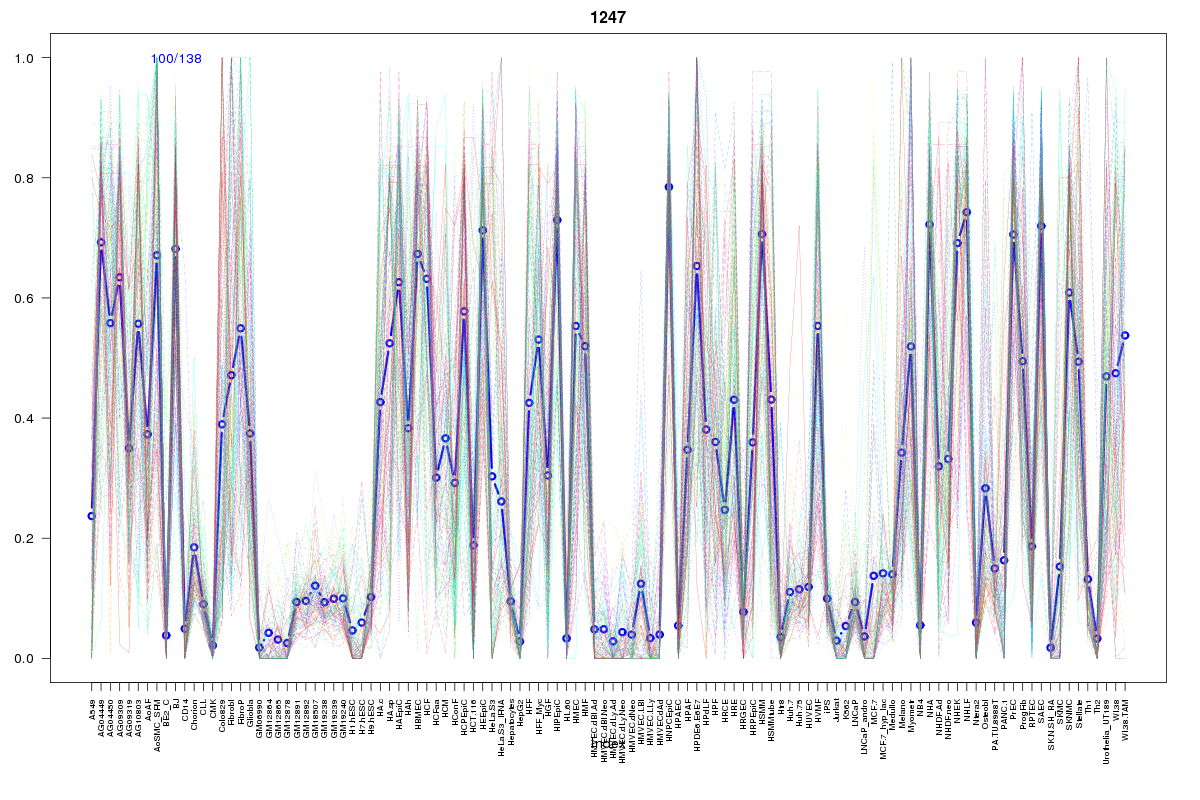
Cluster Hypersensitivity Profile

Genomic Location Trend
These plots show the distribution of the DHS sites surrounding the Transcript Start Site of the nearest gene.
Stats
Number of sites: 138Promoter: 2%
CpG-Island: 0%
Conserved: 31%
Enriched Motifs & Matches
Match Detail: [Jaspar]
|
| ||
|---|---|---|
| Sites: 30/100 | e-val: 0.071 | ||
| Factor | e-val(match) | DB |
| AP1 | 0.0000000016767 | JASPAR |
| NFE2L2 | 0.000000036089 | JASPAR |
| NFE2L1::MafG | 0.00034344 | JASPAR |
| PBX1 | 0.0030327 | JASPAR |
| Pax6 | 0.024279 | JASPAR |
BED file downloads
Top 10 Example Regions
| Location | Gene Link | Dist. |
|---|---|---|
| chr1: 77464360-77464510 | ST6GALNAC5 | 41.3 |
| chr10: 93271760-93271910 | HECTD2 | 47.98 |
| chr8: 141734740-141734890 | AGO2 | 51.71 |
| chr4: 41712020-41712170 | PHOX2B | 52.13 |
| chr4: 41712020-41712170 | OR5M14P | 52.13 |
| chr4: 41712020-41712170 | RP11-227F19.1 | 52.13 |
| chr7: 116074960-116075110 | CAV2 | 53.75 |
| chr7: 116074960-116075110 | CAV1 | 53.75 |
| chr12: 95377960-95378110 | NR2C1 | 58.02 |
| chr5: 125782340-125782490 | GRAMD3 | 59.5 |