SOM cluster: 1249
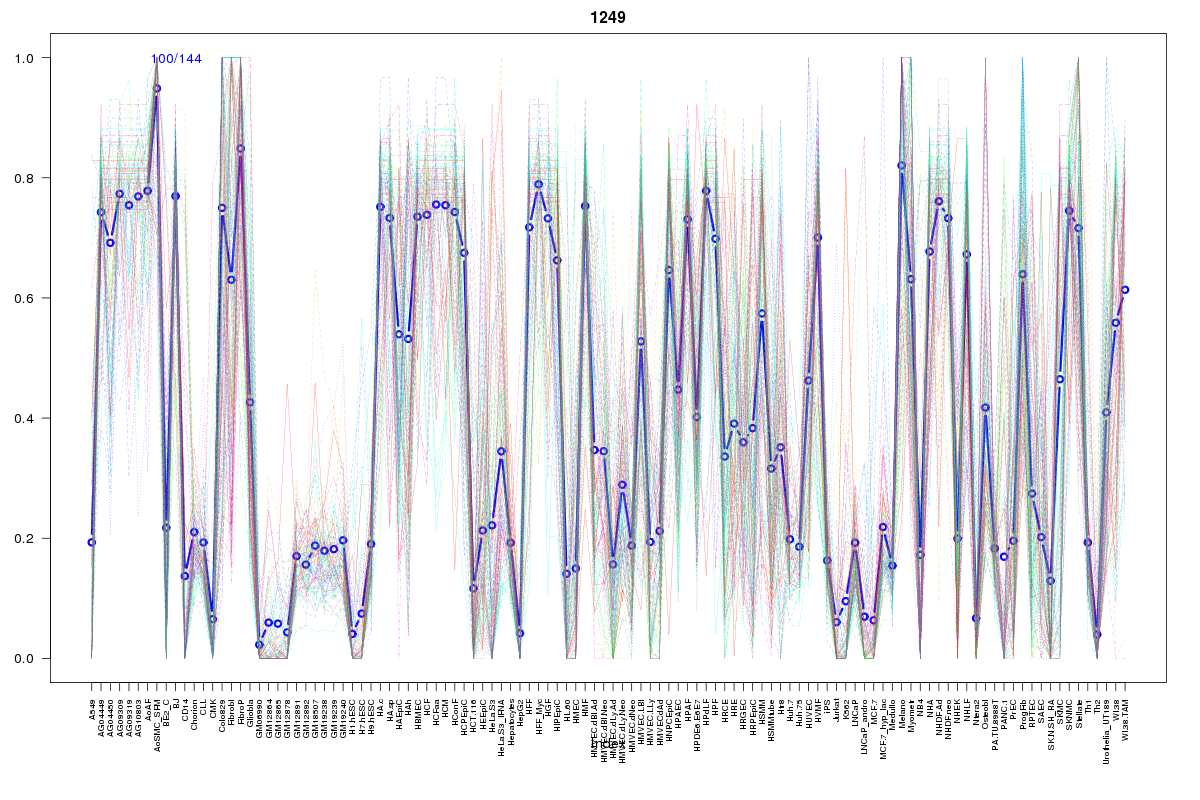
Cluster Hypersensitivity Profile

Genomic Location Trend
These plots show the distribution of the DHS sites surrounding the Transcript Start Site of the nearest gene.
Stats
Number of sites: 144Promoter: 3%
CpG-Island: 0%
Conserved: 66%
Enriched Motifs & Matches
Match Detail: [Jaspar]
|
| ||
|---|---|---|
| Sites: 33/100 | e-val: 1.6 | ||
| Factor | e-val(match) | DB |
| NFE2L2 | 0.00000000030197 | JASPAR |
| AP1 | 0.000000038265 | JASPAR |
| NFE2L1::MafG | 0.0020429 | JASPAR |
| PBX1 | 0.039994 | JASPAR |
| Mafb | 0.058513 | JASPAR |
BED file downloads
Top 10 Example Regions
| Location | Gene Link | Dist. |
|---|---|---|
| chr1: 203662185-203662335 | LAX1 | 33.61 |
| chr1: 203662185-203662335 | SNORA77 | 33.61 |
| chr1: 203662185-203662335 | ATP2B4 | 33.61 |
| chr1: 145683160-145683310 | RNF115 | 46.11 |
| chr1: 145683160-145683310 | PIAS3 | 46.11 |
| chr1: 145683160-145683310 | PDZK1 | 46.11 |
| chr8: 18836420-18836570 | PSD3 | 53 |
| chr8: 48424860-48425010 | RP11-697N18.2 | 55.95 |
| chr8: 121792540-121792690 | SNTB1 | 60.14 |
| chr8: 107231580-107231730 | RP11-395G23.3 | 62.48 |