SOM cluster: 1260
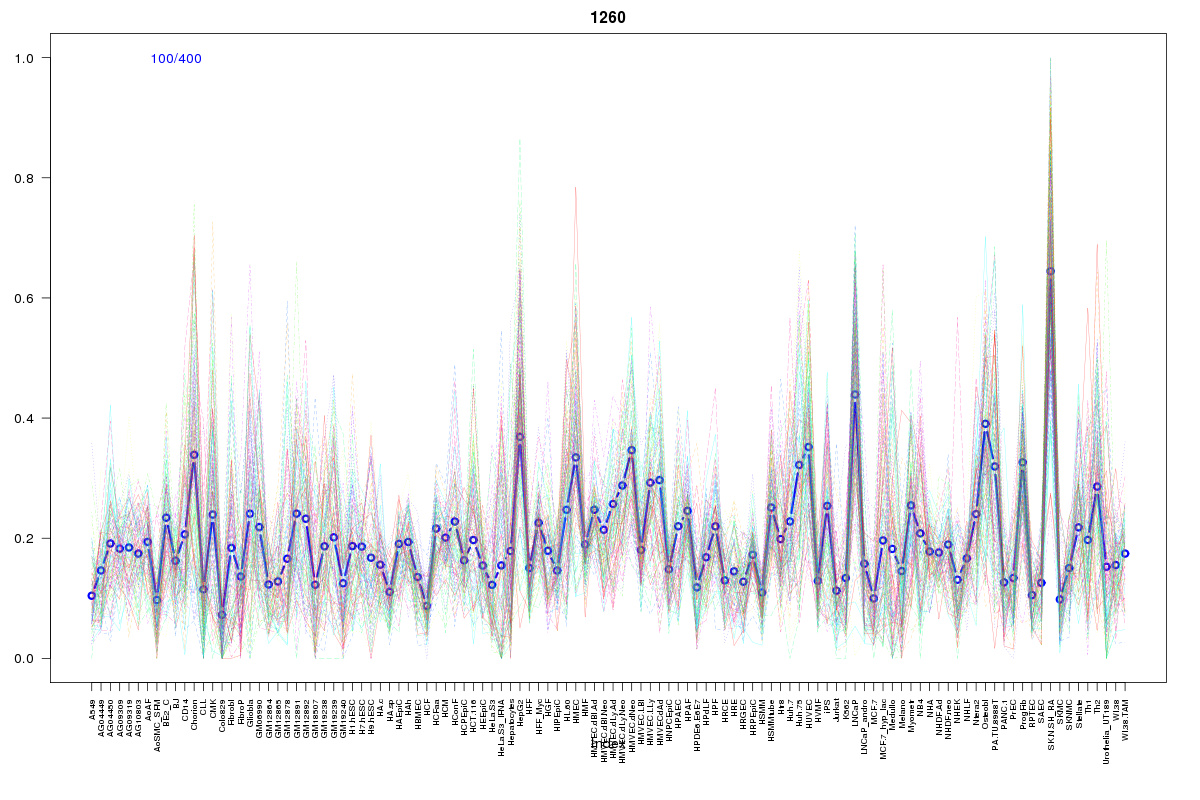
Cluster Hypersensitivity Profile

Genomic Location Trend
These plots show the distribution of the DHS sites surrounding the Transcript Start Site of the nearest gene.
Stats
Number of sites: 400Promoter: 26%
CpG-Island: 98%
Conserved: 76%
Enriched Motifs & Matches
Match Detail: [Jaspar]
|
| ||
|---|---|---|
| Sites: 100/100 | e-val: 0 | ||
| Factor | e-val(match) | DB |
| SP1 | 0.000035552 | JASPAR |
| TFAP2A | 0.00020945 | JASPAR |
| PLAG1 | 0.0016293 | JASPAR |
| Egr1 | 0.0077433 | JASPAR |
| Klf4 | 0.057189 | JASPAR |
|
| ||
| Sites: 96/100 | e-val: 0 | ||
| Factor | e-val(match) | DB |
| TFAP2A | 0.00011409 | JASPAR |
| SP1 | 0.00035444 | JASPAR |
| Egr1 | 0.01217 | JASPAR |
| PLAG1 | 0.049512 | JASPAR |
| Zfx | 0.063209 | JASPAR |
|
| ||
| Sites: 66/100 | e-val: 0.00058 | ||
| Factor | e-val(match) | DB |
| SP1 | 0.0000020886 | JASPAR |
| GABPA | 0.0040468 | JASPAR |
| Myf | 0.0062456 | JASPAR |
| NHLH1 | 0.012385 | JASPAR |
| TFAP2A | 0.020107 | JASPAR |
BED file downloads
Top 10 Example Regions
| Location | Gene Link | Dist. |
|---|---|---|
| chrX: 152954725-152954875 | PLXNB3 | 36.93 |
| chrX: 152954725-152954875 | ABCD1 | 36.93 |
| chrX: 152954725-152954875 | SLC6A8 | 36.93 |
| chrX: 152954725-152954875 | SRPK3 | 36.93 |
| chr1: 204042620-204042770 | SOX13 | 39.77 |
| chr12: 9217085-9217235 | RP11-259O18.4 | 45.81 |
| chr22: 19749685-19749835 | TBX1 | 51.75 |
| chr7: 130418765-130418915 | AC016831.3 | 56.5 |
| chr12: 48396545-48396695 | RP1-228P16.1 | 56.68 |
| chr12: 48396545-48396695 | RP1-228P16.4 | 56.68 |