SOM cluster: 1263
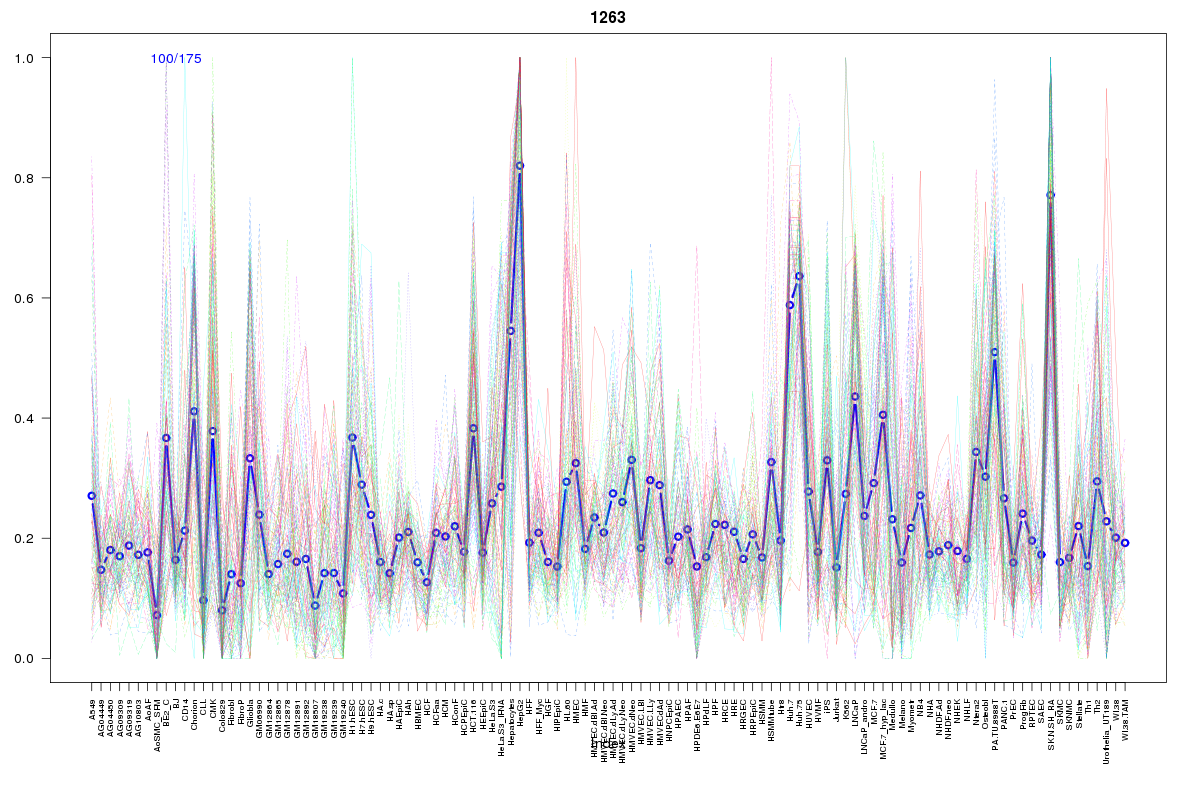
Cluster Hypersensitivity Profile

Genomic Location Trend
These plots show the distribution of the DHS sites surrounding the Transcript Start Site of the nearest gene.
Stats
Number of sites: 175Promoter: 43%
CpG-Island: 72%
Conserved: 61%
Enriched Motifs & Matches
Match Detail: [Jaspar]
|
| ||
|---|---|---|
| Sites: 88/100 | e-val: 0 | ||
| Factor | e-val(match) | DB |
| TFAP2A | 0.00010477 | JASPAR |
| SP1 | 0.00069574 | JASPAR |
| Egr1 | 0.001018 | JASPAR |
| PLAG1 | 0.002023 | JASPAR |
| Zfx | 0.0069077 | JASPAR |
|
| ||
| Sites: 95/100 | e-val: 1.2e-18 | ||
| Factor | e-val(match) | DB |
| SP1 | 0.00000018509 | JASPAR |
| Tal1::Gata1 | 0.0022018 | JASPAR |
| TFAP2A | 0.0022253 | JASPAR |
| EWSR1-FLI1 | 0.0026462 | JASPAR |
| Egr1 | 0.0061059 | JASPAR |
BED file downloads
Top 10 Example Regions
| Location | Gene Link | Dist. |
|---|---|---|
| chr20: 30191785-30191935 | BCL2L1 | 55.23 |
| chr20: 30191785-30191935 | HM13-AS1 | 55.23 |
| chr20: 30191785-30191935 | ID1 | 55.23 |
| chr17: 73761465-73761615 | UNK | 59.4 |
| chr17: 73761465-73761615 | SAP30BP | 59.4 |
| chrX: 152912625-152912775 | DUSP9 | 61.93 |
| chrX: 152912625-152912775 | BCAP31 | 61.93 |
| chrX: 152912625-152912775 | PNCK | 61.93 |
| chr11: 61345320-61345470 | SYT7 | 62.04 |
| chr3: 128206945-128207095 | GATA2 | 63.42 |