SOM cluster: 1267
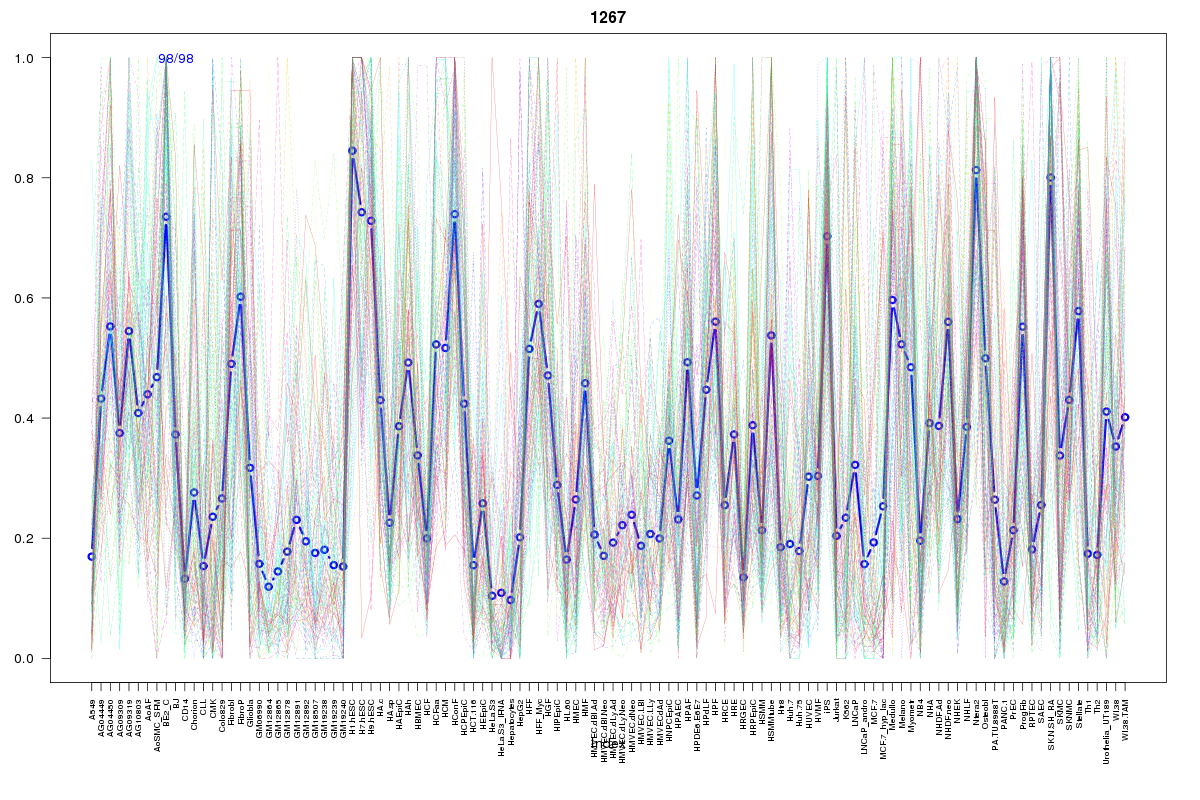
Cluster Hypersensitivity Profile

Genomic Location Trend
These plots show the distribution of the DHS sites surrounding the Transcript Start Site of the nearest gene.
Stats
Number of sites: 98Promoter: 31%
CpG-Island: 39%
Conserved: 79%
Enriched Motifs & Matches
Match Detail: [Jaspar]
|
| ||
|---|---|---|
| Sites: 74/98 | e-val: 0 | ||
| Factor | e-val(match) | DB |
| SP1 | 0.000000010008 | JASPAR |
| PLAG1 | 0.0013642 | JASPAR |
| TFAP2A | 0.00162 | JASPAR |
| Egr1 | 0.0067704 | JASPAR |
| Klf4 | 0.0085332 | JASPAR |
|
| ||
| Sites: 94/98 | e-val: 0.00000000000029 | ||
| Factor | e-val(match) | DB |
| SP1 | 0.000000010193 | JASPAR |
| PLAG1 | 0.0057632 | JASPAR |
| MZF1_5-13 | 0.0086905 | JASPAR |
| INSM1 | 0.014404 | JASPAR |
| Pax4 | 0.016654 | JASPAR |
|
| ||
| Sites: 9/98 | e-val: 2.8 | ||
| Factor | e-val(match) | DB |
| Myb | 0.01005 | JASPAR |
| TLX1::NFIC | 0.014467 | JASPAR |
| BRCA1 | 0.017618 | JASPAR |
| Spz1 | 0.022257 | JASPAR |
| TP53 | 0.022384 | JASPAR |
BED file downloads
Top 10 Example Regions
| Location | Gene Link | Dist. |
|---|---|---|
| chr1: 149889380-149889530 | SV2A | 39.17 |
| chrX: 51239380-51239530 | NUDT11 | 56.62 |
| chr11: 61486125-61486275 | RP11-467L20.10 | 61.49 |
| chr11: 61486125-61486275 | DAGLA | 61.49 |
| chr19: 52956640-52956790 | ZNF610 | 63.59 |
| chr19: 52956640-52956790 | ZNF528 | 63.59 |
| chr19: 52956640-52956790 | ZNF880 | 63.59 |
| chr3: 52039760-52039910 | PARP3 | 64.33 |
| chr3: 52039760-52039910 | ABHD14B | 64.33 |
| chr19: 46974460-46974610 | CCDC8 | 66.04 |