SOM cluster: 1268
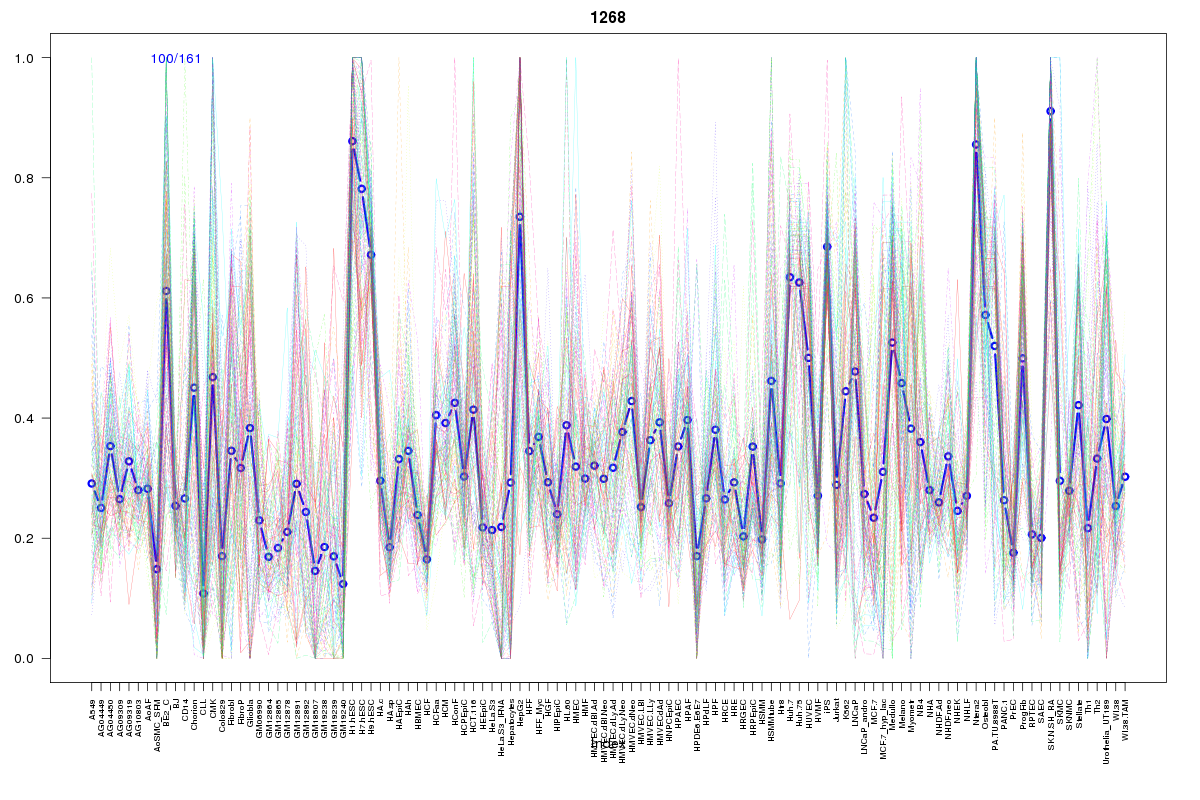
Cluster Hypersensitivity Profile

Genomic Location Trend
These plots show the distribution of the DHS sites surrounding the Transcript Start Site of the nearest gene.
Stats
Number of sites: 161Promoter: 39%
CpG-Island: 72%
Conserved: 71%
Enriched Motifs & Matches
Match Detail: [Jaspar]
|
| ||
|---|---|---|
| Sites: 95/100 | e-val: 0 | ||
| Factor | e-val(match) | DB |
| SP1 | 0.00000019595 | JASPAR |
| Egr1 | 0.00072571 | JASPAR |
| TFAP2A | 0.0012923 | JASPAR |
| PLAG1 | 0.004762 | JASPAR |
| Zfx | 0.011305 | JASPAR |
|
| ||
| Sites: 86/100 | e-val: 0 | ||
| Factor | e-val(match) | DB |
| EWSR1-FLI1 | 0.000012723 | JASPAR |
| SP1 | 0.000015579 | JASPAR |
| TFAP2A | 0.0034718 | JASPAR |
| Egr1 | 0.017382 | JASPAR |
| PLAG1 | 0.038347 | JASPAR |
|
| ||
| Sites: 36/100 | e-val: 0.7 | ||
| Factor | e-val(match) | DB |
| SP1 | 0.00000014515 | JASPAR |
| TFAP2A | 0.00018068 | JASPAR |
| PLAG1 | 0.00036206 | JASPAR |
| INSM1 | 0.00053502 | JASPAR |
| Klf4 | 0.0038182 | JASPAR |
BED file downloads
Top 10 Example Regions
| Location | Gene Link | Dist. |
|---|---|---|
| chr1: 93914140-93914290 | FNBP1L | 41.74 |
| chr19: 34288800-34288950 | KCTD15 | 52.74 |
| chr4: 73434940-73435090 | ADAMTS3 | 57.55 |
| chr5: 71403120-71403270 | MAP1B | 61.74 |
| chr19: 50015880-50016030 | PRRG2 | 63.96 |
| chr17: 76349285-76349435 | RP11-219G17.4 | 65.48 |
| chr5: 139088880-139089030 | CXXC5 | 65.69 |
| chr2: 220386020-220386170 | AC053503.11 | 66.42 |
| chr2: 8818260-8818410 | ID2 | 66.84 |
| chr12: 6930820-6930970 | LAG3 | 69.21 |