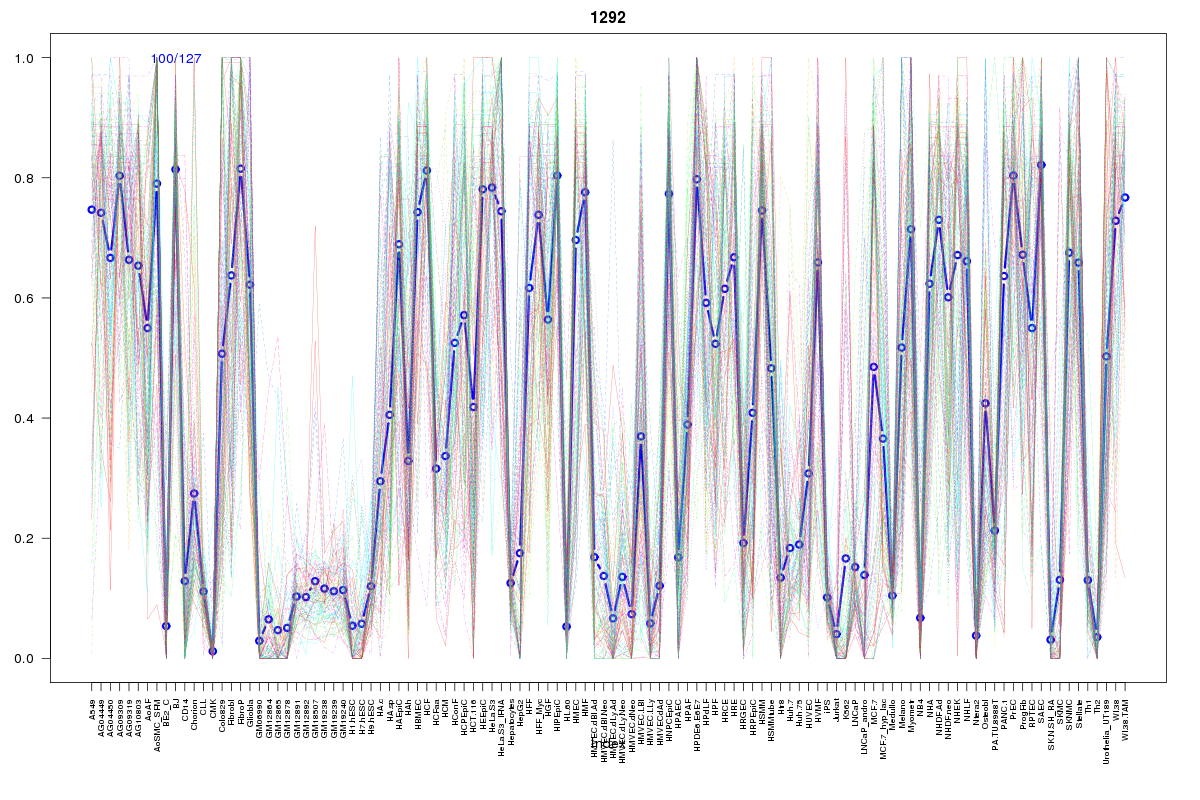
SOM cluster: 1292
Cluster Hypersensitivity Profile

Genomic Location Trend
These plots show the distribution of the DHS sites surrounding the Transcript Start Site of the nearest gene.
Stats
Number of sites: 127Promoter: 1%
CpG-Island: 0%
Conserved: 42%
Enriched Motifs & Matches
Match Detail: [Jaspar]
|
| ||
|---|---|---|
| Sites: 57/100 | e-val: 1.2e-18 | ||
| Factor | e-val(match) | DB |
| NFE2L2 | 0.0000000000011124 | JASPAR |
| AP1 | 0.00000033333 | JASPAR |
| NFE2L1::MafG | 0.0034266 | JASPAR |
| znf143 | 0.047574 | JASPAR |
| Tal1::Gata1 | 0.055554 | JASPAR |
|
| ||
| Sites: 15/100 | e-val: 0.83 | ||
| Factor | e-val(match) | DB |
| Foxd3 | 0.00047051 | JASPAR |
| FOXI1 | 0.00096922 | JASPAR |
| Pax4 | 0.0014316 | JASPAR |
| Foxq1 | 0.0081849 | JASPAR |
| SRY | 0.0087674 | JASPAR |
BED file downloads
Top 10 Example Regions
| Location | Gene Link | Dist. |
|---|---|---|
| chr8: 122543780-122543930 | HAS2 | 47.07 |
| chr8: 119909320-119909470 | TNFRSF11B | 48.51 |
| chr4: 87752720-87752870 | PTPN13 | 55.69 |
| chr4: 87752720-87752870 | RP11-397E7.1 | 55.69 |
| chr4: 87752720-87752870 | RP11-397E7.2 | 55.69 |
| chr2: 75145000-75145150 | AC104135.4 | 59.9 |
| chr2: 75145000-75145150 | AC104135.3 | 59.9 |
| chr11: 34621140-34621290 | ELF5 | 61.22 |
| chr9: 129553780-129553930 | ZBTB43 | 62.79 |
| chr15: 71119080-71119230 | THAP10 | 66.25 |