SOM cluster: 1295
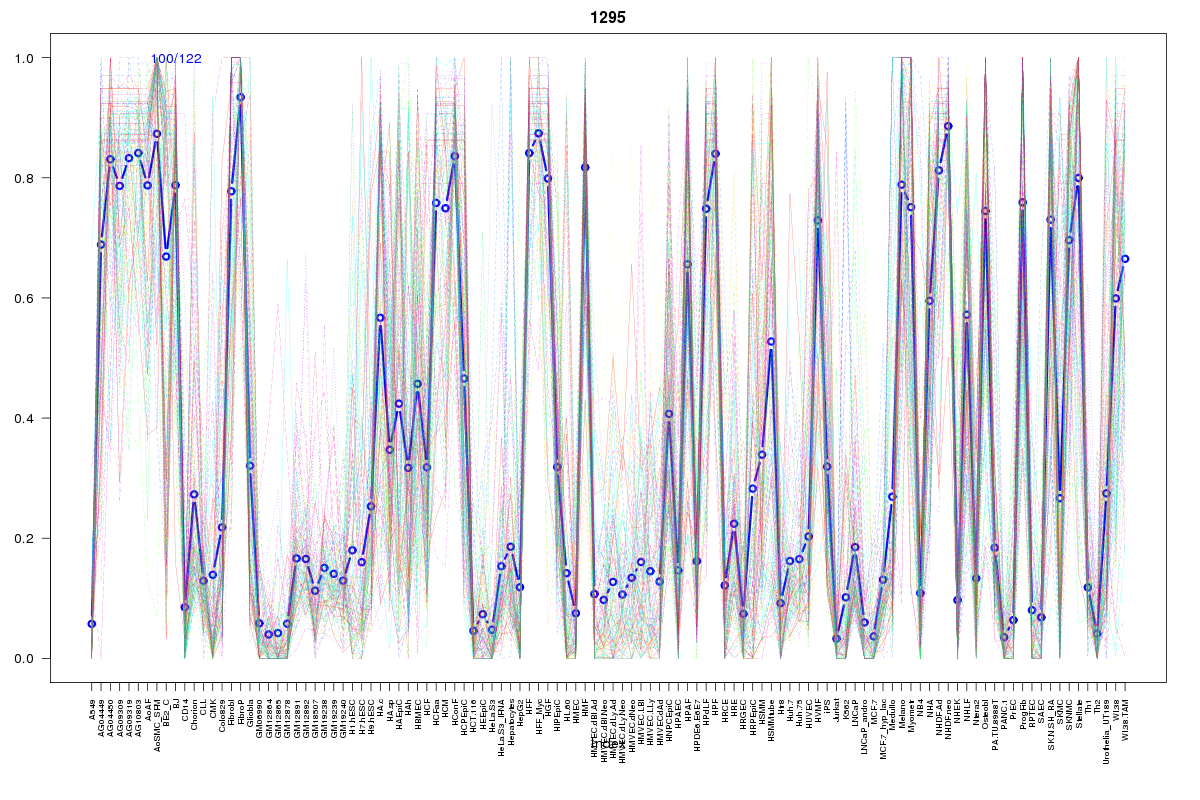
Cluster Hypersensitivity Profile

Genomic Location Trend
These plots show the distribution of the DHS sites surrounding the Transcript Start Site of the nearest gene.
Stats
Number of sites: 122Promoter: 15%
CpG-Island: 3%
Conserved: 83%
Enriched Motifs & Matches
Match Detail: [Jaspar]
|
| ||
|---|---|---|
| Sites: 92/100 | e-val: 6.89999e-42 | ||
| Factor | e-val(match) | DB |
| Pax4 | 0.0000025848 | JASPAR |
| SP1 | 0.0000047052 | JASPAR |
| EWSR1-FLI1 | 0.000035358 | JASPAR |
| RXR::RAR_DR5 | 0.00082624 | JASPAR |
| RREB1 | 0.0091512 | JASPAR |
|
| ||
| Sites: 56/100 | e-val: 5e-25 | ||
| Factor | e-val(match) | DB |
| TAL1::TCF3 | 0.000023643 | JASPAR |
| NFATC2 | 0.00012932 | JASPAR |
| FOXO3 | 0.013208 | JASPAR |
| Myf | 0.018959 | JASPAR |
| Tcfcp2l1 | 0.024723 | JASPAR |
|
| ||
| Sites: 47/100 | e-val: 0.0000000011 | ||
| Factor | e-val(match) | DB |
| TLX1::NFIC | 0.00011338 | JASPAR |
| TFAP2A | 0.0019813 | JASPAR |
| SP1 | 0.02602 | JASPAR |
| NFE2L2 | 0.032389 | JASPAR |
| Zfx | 0.035769 | JASPAR |
BED file downloads
Top 10 Example Regions
| Location | Gene Link | Dist. |
|---|---|---|
| chr8: 37659820-37659970 | RAB11FIP1 | 38.63 |
| chr8: 37659820-37659970 | GPR124 | 38.63 |
| chr9: 133321900-133322050 | snoU13 | 43.95 |
| chr22: 19786960-19787110 | SEPT5 | 56.69 |
| chr22: 19786960-19787110 | GNB1L | 56.69 |
| chr12: 109003440-109003590 | CORO1C | 59.16 |
| chr12: 109003440-109003590 | TMEM119 | 59.16 |
| chr1: 161167040-161167190 | PFDN2 | 60.62 |
| chr1: 161167040-161167190 | APOA2 | 60.62 |
| chr1: 161167040-161167190 | NR1I3 | 60.62 |