SOM cluster: 1307
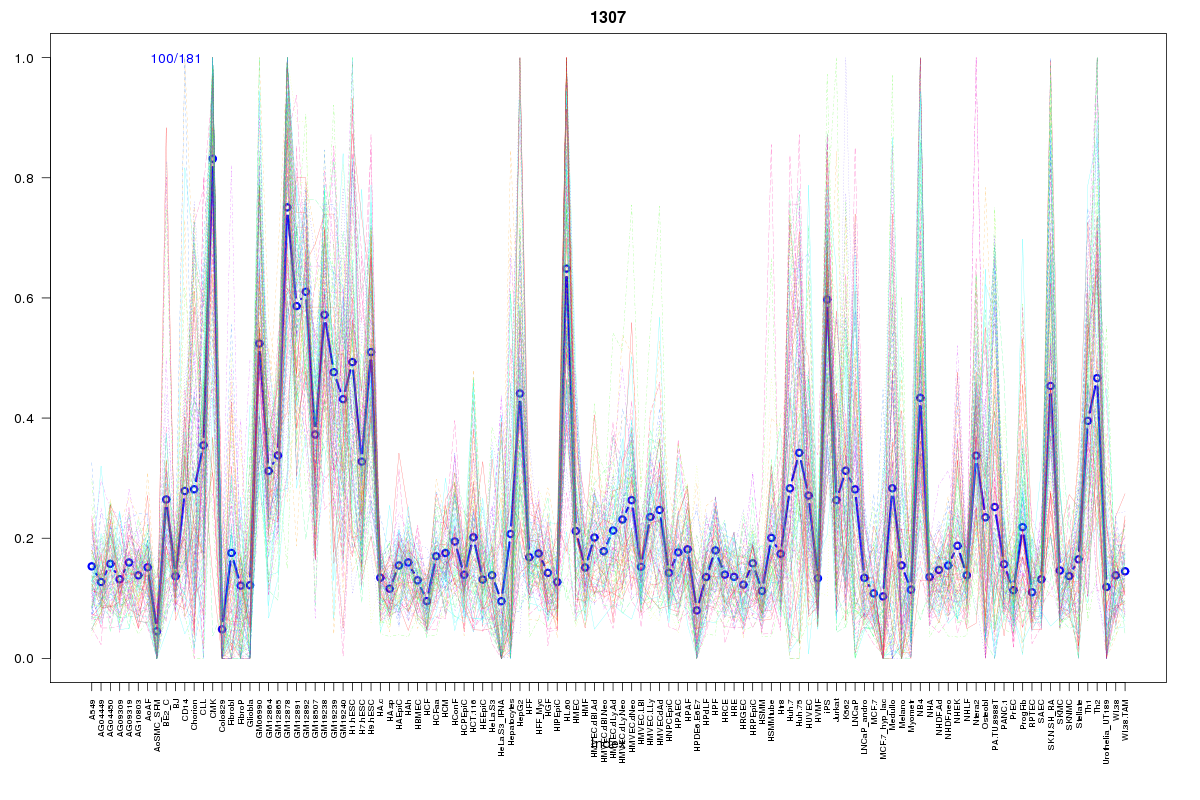
Cluster Hypersensitivity Profile

Genomic Location Trend
These plots show the distribution of the DHS sites surrounding the Transcript Start Site of the nearest gene.
Stats
Number of sites: 181Promoter: 32%
CpG-Island: 64%
Conserved: 58%
Enriched Motifs & Matches
Match Detail: [Jaspar]
|
| ||
|---|---|---|
| Sites: 94/100 | e-val: 0 | ||
| Factor | e-val(match) | DB |
| SP1 | 0.0000000000013779 | JASPAR |
| Egr1 | 0.0008291 | JASPAR |
| RREB1 | 0.0012743 | JASPAR |
| Klf4 | 0.0034996 | JASPAR |
| PLAG1 | 0.00944 | JASPAR |
|
| ||
| Sites: 83/100 | e-val: 1.8e-33 | ||
| Factor | e-val(match) | DB |
| SP1 | 0.0000014499 | JASPAR |
| Klf4 | 0.0089482 | JASPAR |
| RREB1 | 0.0098947 | JASPAR |
| Pax4 | 0.019299 | JASPAR |
| Egr1 | 0.036671 | JASPAR |
|
| ||
| Sites: 38/100 | e-val: 0.0000086 | ||
| Factor | e-val(match) | DB |
| SP1 | 0.00000000015043 | JASPAR |
| Klf4 | 0.00033583 | JASPAR |
| PPARG::RXRA | 0.0048534 | JASPAR |
| Pax4 | 0.0073599 | JASPAR |
| RREB1 | 0.0078475 | JASPAR |
BED file downloads
Top 10 Example Regions
| Location | Gene Link | Dist. |
|---|---|---|
| chr3: 53203120-53203270 | RFT1 | 41.61 |
| chr3: 53203120-53203270 | PRKCD | 41.61 |
| chr12: 111126820-111126970 | HVCN1 | 49.47 |
| chr12: 111126820-111126970 | TCTN1 | 49.47 |
| chr19: 51014040-51014190 | JOSD2 | 50.52 |
| chr17: 73584360-73584510 | CASKIN2 | 53.27 |
| chr19: 13227160-13227310 | IER2 | 57.39 |
| chr19: 13227160-13227310 | NFIX | 57.39 |
| chr19: 13227160-13227310 | TRMT1 | 57.39 |
| chr2: 127413685-127413835 | GYPC | 58.4 |