SOM cluster: 1308
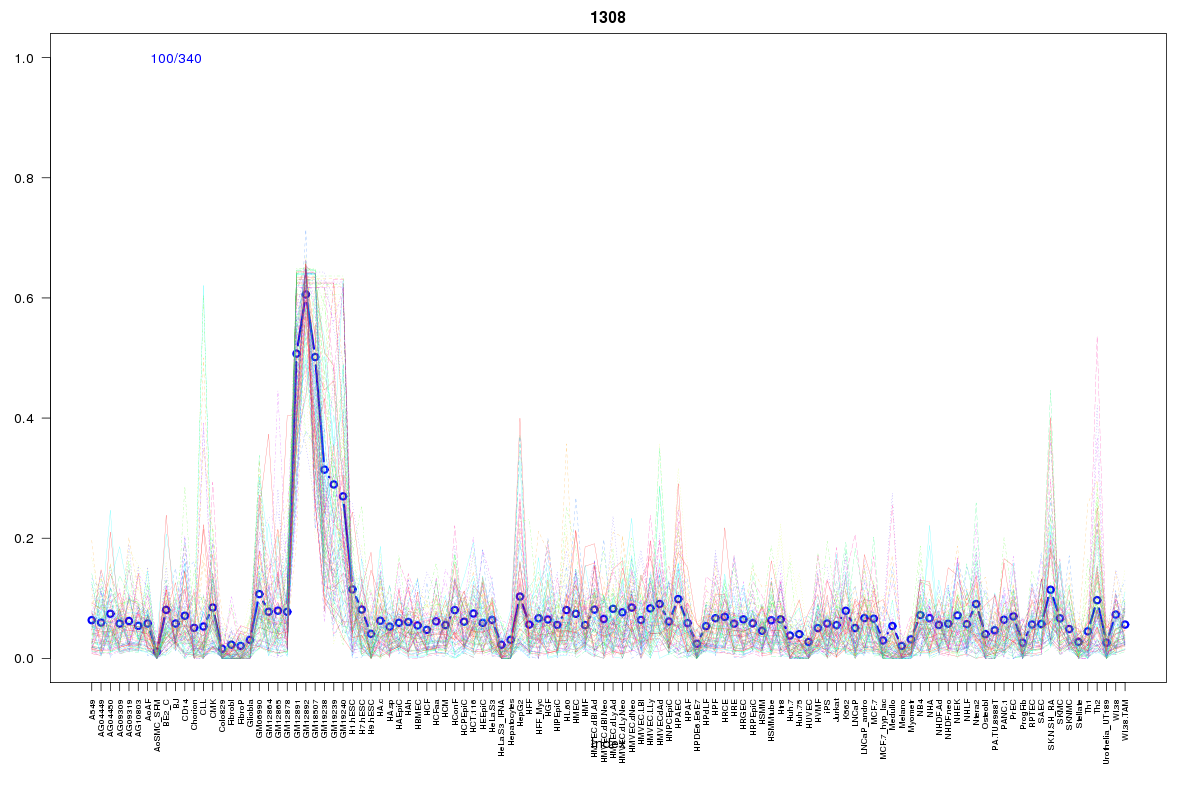
Cluster Hypersensitivity Profile

Genomic Location Trend
These plots show the distribution of the DHS sites surrounding the Transcript Start Site of the nearest gene.
Stats
Number of sites: 340Promoter: 1%
CpG-Island: 4%
Conserved: 25%
Enriched Motifs & Matches
Match Detail: [Jaspar]
|
| ||
|---|---|---|
| Sites: 47/100 | e-val: 0.000000028 | ||
| Factor | e-val(match) | DB |
| SP1 | 0.00000044127 | JASPAR |
| Pax4 | 0.0000011309 | JASPAR |
| RREB1 | 0.00057153 | JASPAR |
| MZF1_5-13 | 0.0014802 | JASPAR |
| EWSR1-FLI1 | 0.0023924 | JASPAR |
|
| ||
| Sites: 31/100 | e-val: 0.0097 | ||
| Factor | e-val(match) | DB |
| SP1 | 0.0015607 | JASPAR |
| PPARG::RXRA | 0.0023569 | JASPAR |
| CTCF | 0.0026495 | JASPAR |
| Tal1::Gata1 | 0.0065477 | JASPAR |
| EWSR1-FLI1 | 0.0069334 | JASPAR |
BED file downloads
Top 10 Example Regions
| Location | Gene Link | Dist. |
|---|---|---|
| chr1: 75596860-75597010 | RP11-510C10.2 | 31.54 |
| chr17: 41930525-41930675 | MPP2 | 47.69 |
| chr17: 41930525-41930675 | PYY | 47.69 |
| chr20: 48501425-48501575 | SNAI1 | 59.69 |
| chr8: 61968405-61968555 | AC022182.1 | 60.28 |
| chr8: 61968405-61968555 | AC022182.3 | 60.28 |
| chr19: 51255905-51256055 | KLK1 | 63.17 |
| chr19: 51255905-51256055 | SHANK1 | 63.17 |
| chr17: 77973685-77973835 | CCDC40 | 64.04 |
| chr1: 19042525-19042675 | PAX7 | 68.76 |