SOM cluster: 1309
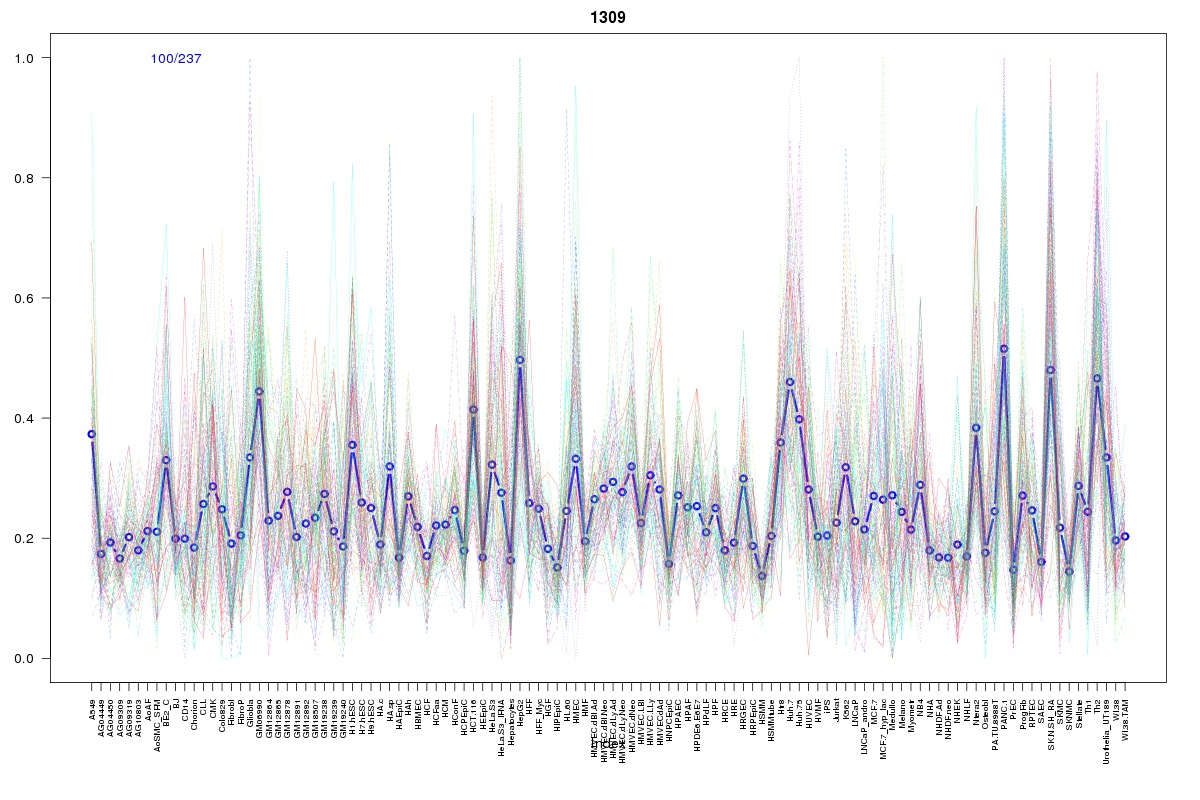
Cluster Hypersensitivity Profile

Genomic Location Trend
These plots show the distribution of the DHS sites surrounding the Transcript Start Site of the nearest gene.
Stats
Number of sites: 237Promoter: 54%
CpG-Island: 60%
Conserved: 31%
Enriched Motifs & Matches
Match Detail: [Jaspar]
|
| ||
|---|---|---|
| Sites: 54/100 | e-val: 0.0000002 | ||
| Factor | e-val(match) | DB |
| SP1 | 0.0000041655 | JASPAR |
| Egr1 | 0.0057166 | JASPAR |
| TFAP2A | 0.0089216 | JASPAR |
| GABPA | 0.01077 | JASPAR |
| PLAG1 | 0.020318 | JASPAR |
BED file downloads
Top 10 Example Regions
| Location | Gene Link | Dist. |
|---|---|---|
| chr8: 120867825-120867975 | DSCC1 | 46.69 |
| chr6: 35889045-35889195 | SRPK1 | 58.78 |
| chr19: 44711820-44711970 | ZNF233 | 61.38 |
| chr12: 68041980-68042130 | DYRK2 | 64.1 |
| chr8: 144450420-144450570 | TOP1MT | 64.83 |
| chr8: 144450420-144450570 | RP13-582O9.5 | 64.83 |
| chr8: 144450420-144450570 | ZC3H3 | 64.83 |
| chr19: 44711380-44711530 | ZNF227 | 68.21 |
| chr2: 208656905-208657055 | FZD5 | 69.35 |
| chr2: 208656905-208657055 | CCNYL1 | 69.35 |