SOM cluster: 1313
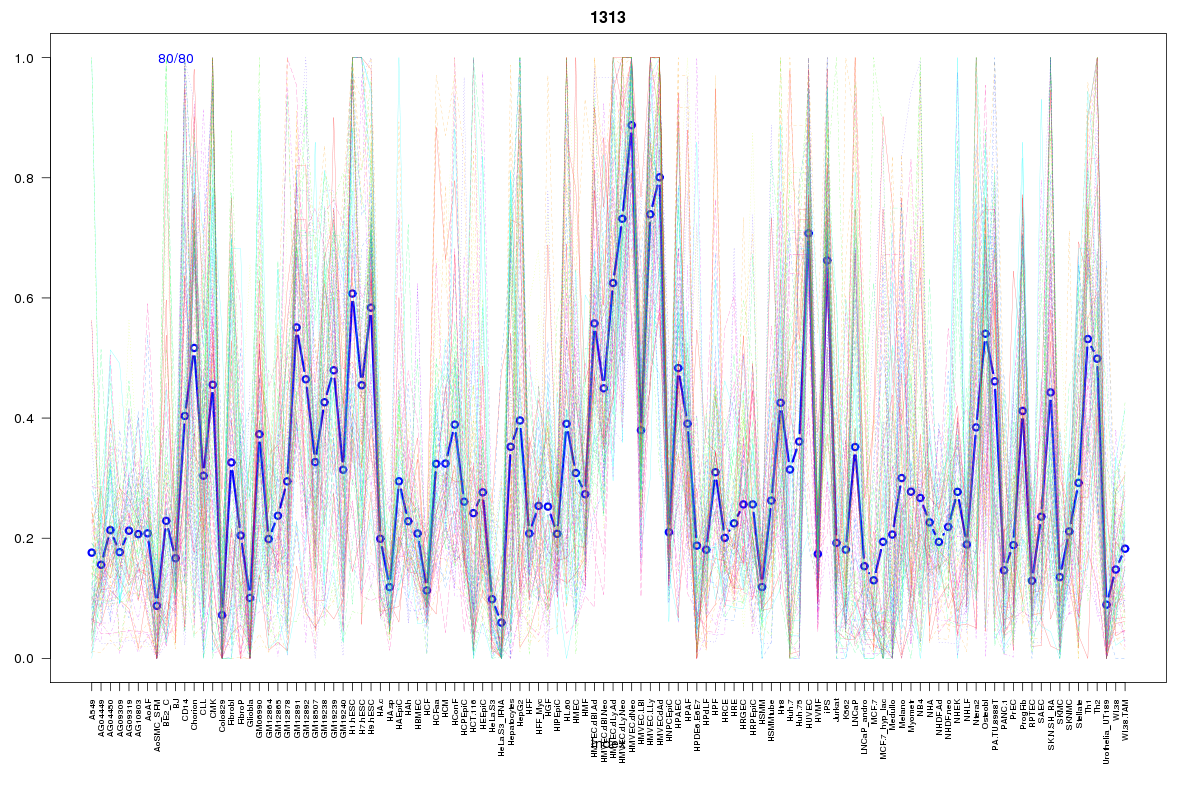
Cluster Hypersensitivity Profile

Genomic Location Trend
These plots show the distribution of the DHS sites surrounding the Transcript Start Site of the nearest gene.
Stats
Number of sites: 80Promoter: 31%
CpG-Island: 64%
Conserved: 66%
Enriched Motifs & Matches
Match Detail: [Jaspar]
|
| ||
|---|---|---|
| Sites: 74/80 | e-val: 0 | ||
| Factor | e-val(match) | DB |
| SP1 | 0.0000052069 | JASPAR |
| TFAP2A | 0.0023632 | JASPAR |
| Klf4 | 0.011764 | JASPAR |
| INSM1 | 0.018333 | JASPAR |
| Egr1 | 0.025075 | JASPAR |
|
| ||
| Sites: 56/80 | e-val: 2.8e-21 | ||
| Factor | e-val(match) | DB |
| TFAP2A | 0.00084589 | JASPAR |
| SP1 | 0.0017354 | JASPAR |
| Klf4 | 0.010629 | JASPAR |
| PLAG1 | 0.016932 | JASPAR |
| INSM1 | 0.021436 | JASPAR |
|
| ||
| Sites: 57/80 | e-val: 0.00000000000018 | ||
| Factor | e-val(match) | DB |
| SP1 | 0.00040097 | JASPAR |
| Klf4 | 0.0050795 | JASPAR |
| PLAG1 | 0.0055803 | JASPAR |
| TFAP2A | 0.009402 | JASPAR |
| Egr1 | 0.017165 | JASPAR |
BED file downloads
Top 10 Example Regions
| Location | Gene Link | Dist. |
|---|---|---|
| chr19: 3683740-3683890 | GIPC3 | 51.5 |
| chr19: 3683740-3683890 | MRPL54 | 51.5 |
| chr5: 176023920-176024070 | GPRIN1 | 58.8 |
| chr1: 6268820-6268970 | LINC00337 | 59.07 |
| chrX: 47497020-47497170 | RP1-212G6.4 | 66.54 |
| chr3: 51990520-51990670 | ABHD14A | 86.46 |
| chr3: 51990520-51990670 | PARP3 | 86.46 |
| chr22: 20785265-20785415 | RNU6-225P | 87.2 |
| chr22: 20785265-20785415 | SCARF2 | 87.2 |
| chr17: 74379040-74379190 | QRICH2 | 91.87 |