SOM cluster: 1317
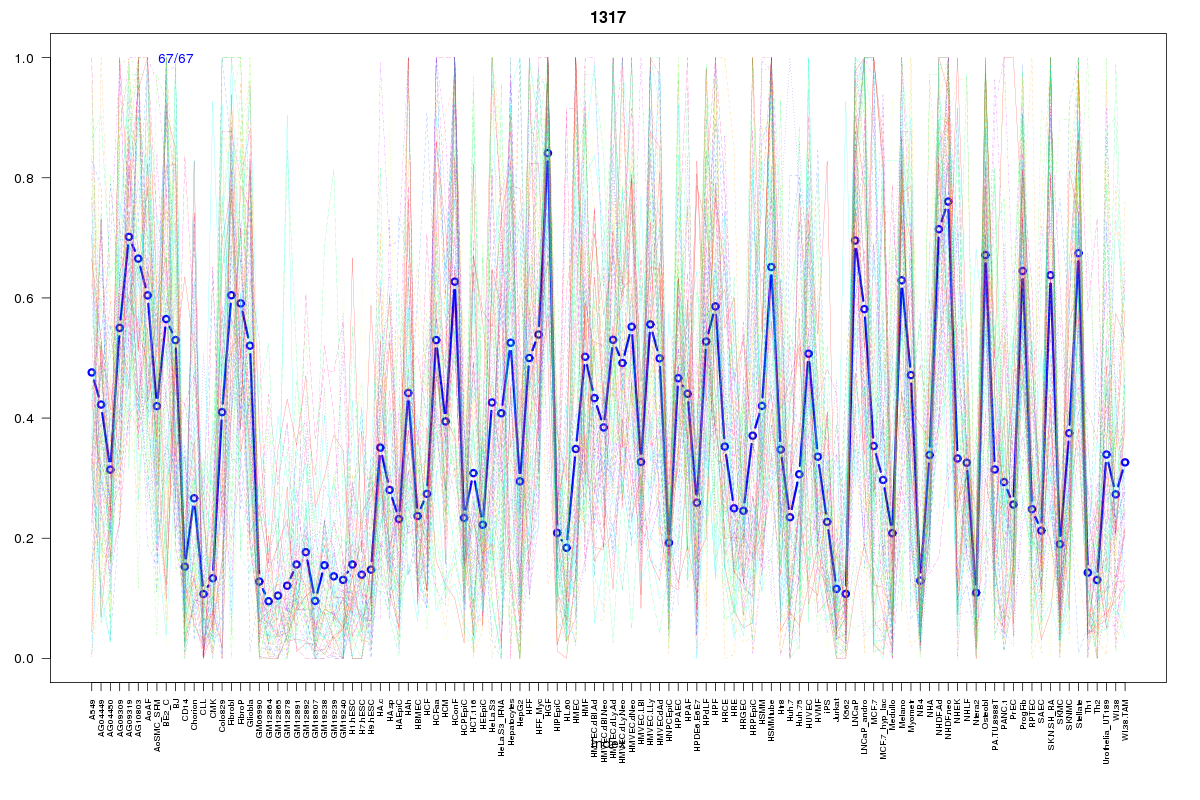
Cluster Hypersensitivity Profile

Genomic Location Trend
These plots show the distribution of the DHS sites surrounding the Transcript Start Site of the nearest gene.
Stats
Number of sites: 67Promoter: 18%
CpG-Island: 8%
Conserved: 44%
Enriched Motifs & Matches
Match Detail: [Jaspar]
|
| ||
|---|---|---|
| Sites: 56/67 | e-val: 1.4e-30 | ||
| Factor | e-val(match) | DB |
| SP1 | 0.000036879 | JASPAR |
| PLAG1 | 0.0041637 | JASPAR |
| INSM1 | 0.0098287 | JASPAR |
| EBF1 | 0.039989 | JASPAR |
| MZF1_1-4 | 0.040959 | JASPAR |
|
| ||
| Sites: 38/67 | e-val: 0.00009 | ||
| Factor | e-val(match) | DB |
| PLAG1 | 0.00047941 | JASPAR |
| SP1 | 0.0027281 | JASPAR |
| INSM1 | 0.0045791 | JASPAR |
| Stat3 | 0.012751 | JASPAR |
| RXR::RAR_DR5 | 0.022439 | JASPAR |
|
| ||
| Sites: 21/67 | e-val: 0.00000093 | ||
| Factor | e-val(match) | DB |
| PLAG1 | 0.000008099 | JASPAR |
| NHLH1 | 0.0049093 | JASPAR |
| NFE2L2 | 0.010149 | JASPAR |
| CTCF | 0.012494 | JASPAR |
| TAL1::TCF3 | 0.048362 | JASPAR |
BED file downloads
Top 10 Example Regions
| Location | Gene Link | Dist. |
|---|---|---|
| chr19: 940600-940750 | ARID3A | 55.76 |
| chr17: 38488420-38488570 | GJD3 | 56.45 |
| chr17: 38488420-38488570 | CDC6 | 56.45 |
| chr17: 38488420-38488570 | RARA | 56.45 |
| chr1: 203275620-203275770 | LINC01136 | 60.56 |
| chr1: 203275620-203275770 | NPM1P40 | 60.56 |
| chr22: 46448665-46448815 | LINC00899 | 65.28 |
| chr22: 46448665-46448815 | C22orf26 | 65.28 |
| chr22: 46448665-46448815 | RP6-109B7.3 | 65.28 |
| chr22: 46448665-46448815 | PPARA | 65.28 |