SOM cluster: 1321
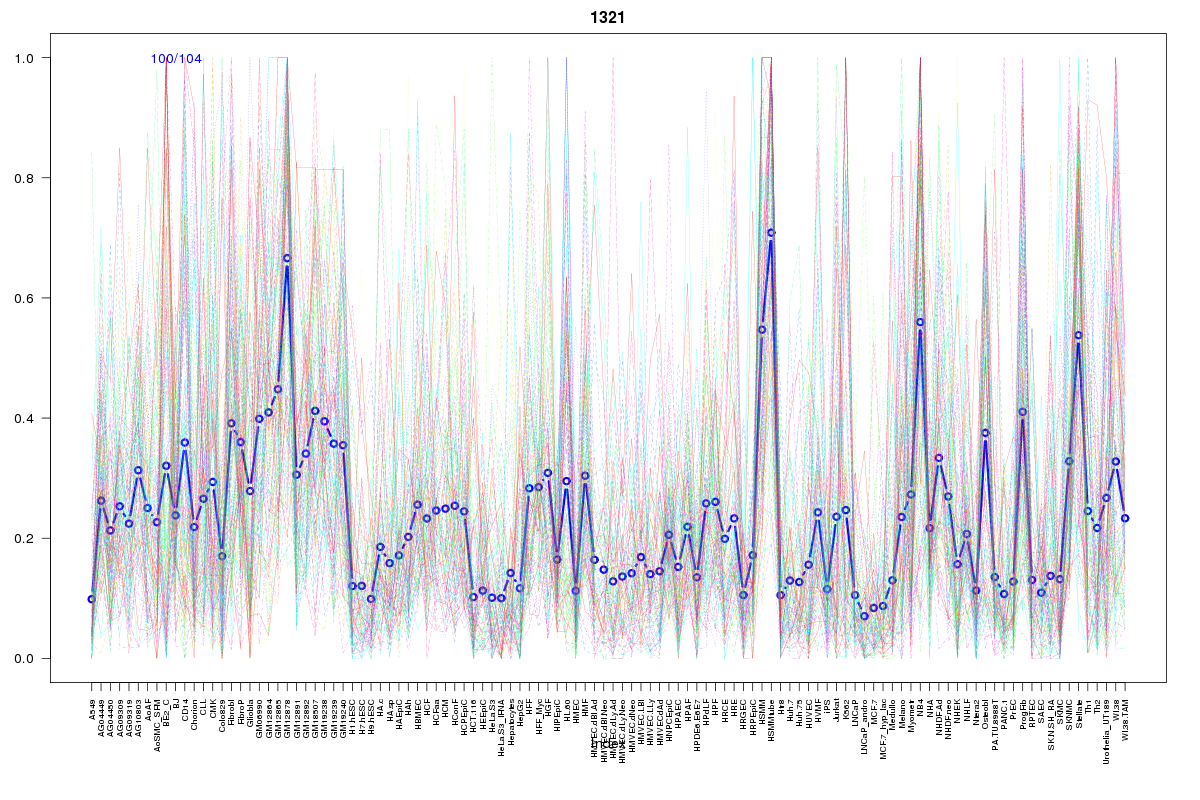
Cluster Hypersensitivity Profile

Genomic Location Trend
These plots show the distribution of the DHS sites surrounding the Transcript Start Site of the nearest gene.
Stats
Number of sites: 104Promoter: 8%
CpG-Island: 3%
Conserved: 42%
Enriched Motifs & Matches
Match Detail: [Jaspar]
|
| ||
|---|---|---|
| Sites: 58/100 | e-val: 0.0000000000033 | ||
| Factor | e-val(match) | DB |
| SP1 | 0.000085097 | JASPAR |
| TFAP2A | 0.0020096 | JASPAR |
| INSM1 | 0.0028691 | JASPAR |
| EWSR1-FLI1 | 0.010421 | JASPAR |
| Tal1::Gata1 | 0.018231 | JASPAR |
|
| ||
| Sites: 32/100 | e-val: 0.0000000045 | ||
| Factor | e-val(match) | DB |
| EBF1 | 0.0000000030925 | JASPAR |
| INSM1 | 0.00023636 | JASPAR |
| MZF1_1-4 | 0.00034497 | JASPAR |
| TFAP2A | 0.00045041 | JASPAR |
| Zfp423 | 0.00062047 | JASPAR |
BED file downloads
Top 10 Example Regions
| Location | Gene Link | Dist. |
|---|---|---|
| chr17: 71287485-71287635 | SDK2 | 32.75 |
| chr22: 39868005-39868155 | MGAT3 | 34.15 |
| chr22: 20234720-20234870 | XXbac-B444P24.8 | 52.47 |
| chr11: 119380740-119380890 | THY1 | 65.4 |
| chr8: 72756405-72756555 | RP11-383H13.1 | 70.27 |
| chr8: 72756405-72756555 | MSC | 70.27 |
| chr5: 149539400-149539550 | PDGFRB | 75.94 |
| chr3: 16553960-16554110 | RFTN1 | 75.98 |
| chr12: 6712280-6712430 | IFFO1 | 82.17 |
| chr15: 78360900-78361050 | SH2D7 | 85.7 |