SOM cluster: 1323
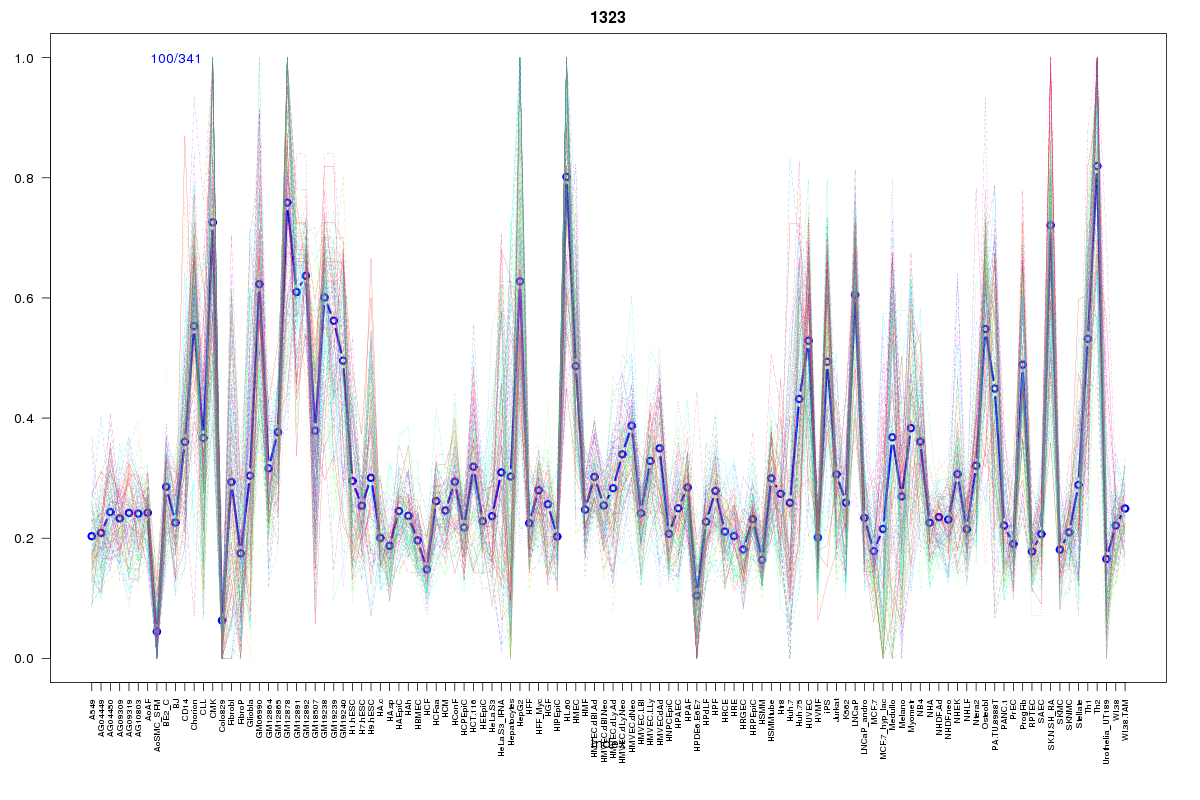
Cluster Hypersensitivity Profile

Genomic Location Trend
These plots show the distribution of the DHS sites surrounding the Transcript Start Site of the nearest gene.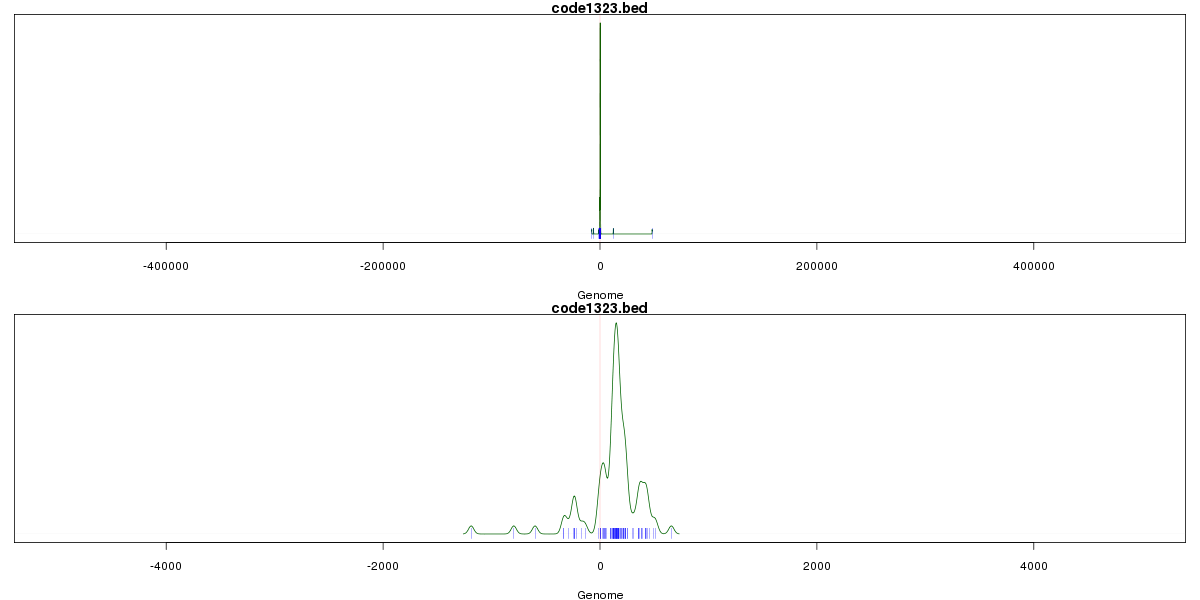
Stats
Number of sites: 341Promoter: 33%
CpG-Island: 95%
Conserved: 65%
Enriched Motifs & Matches
Match Detail: [Jaspar]
|
| ||
|---|---|---|
| Sites: 94/100 | e-val: 0 | ||
| Factor | e-val(match) | DB |
| SP1 | 0.0000014947 | JASPAR |
| TFAP2A | 0.0010888 | JASPAR |
| Klf4 | 0.00319 | JASPAR |
| PLAG1 | 0.0083985 | JASPAR |
| Egr1 | 0.015697 | JASPAR |
|
| ||
| Sites: 89/100 | e-val: 0 | ||
| Factor | e-val(match) | DB |
| SP1 | 0.000094373 | JASPAR |
| PLAG1 | 0.0029925 | JASPAR |
| Klf4 | 0.0044807 | JASPAR |
| TFAP2A | 0.007061 | JASPAR |
| RREB1 | 0.043781 | JASPAR |
|
| ||
| Sites: 72/100 | e-val: 8.1e-17 | ||
| Factor | e-val(match) | DB |
| TFAP2A | 0.000035649 | JASPAR |
| SP1 | 0.00004236 | JASPAR |
| PLAG1 | 0.0031677 | JASPAR |
| EBF1 | 0.01234 | JASPAR |
| MZF1_1-4 | 0.015918 | JASPAR |
BED file downloads
Top 10 Example Regions
| Location | Gene Link | Dist. |
|---|---|---|
| chr3: 127391385-127391535 | TPRA1 | 41.47 |
| chr3: 127391385-127391535 | MCM2 | 41.47 |
| chr16: 3070440-3070590 | PKMYT1 | 48.07 |
| chr9: 139440225-139440375 | SEC16A | 51.66 |
| chr9: 139440225-139440375 | RP11-611D20.2 | 51.66 |
| chr11: 64782040-64782190 | CDCA5 | 53.07 |
| chr3: 184080100-184080250 | RP11-433C9.2 | 54.22 |
| chr1: 161129445-161129595 | PCP4L1 | 57.91 |
| chr1: 161129445-161129595 | PVRL4 | 57.91 |
| chr1: 161129445-161129595 | NR1I3 | 57.91 |