SOM cluster: 1333
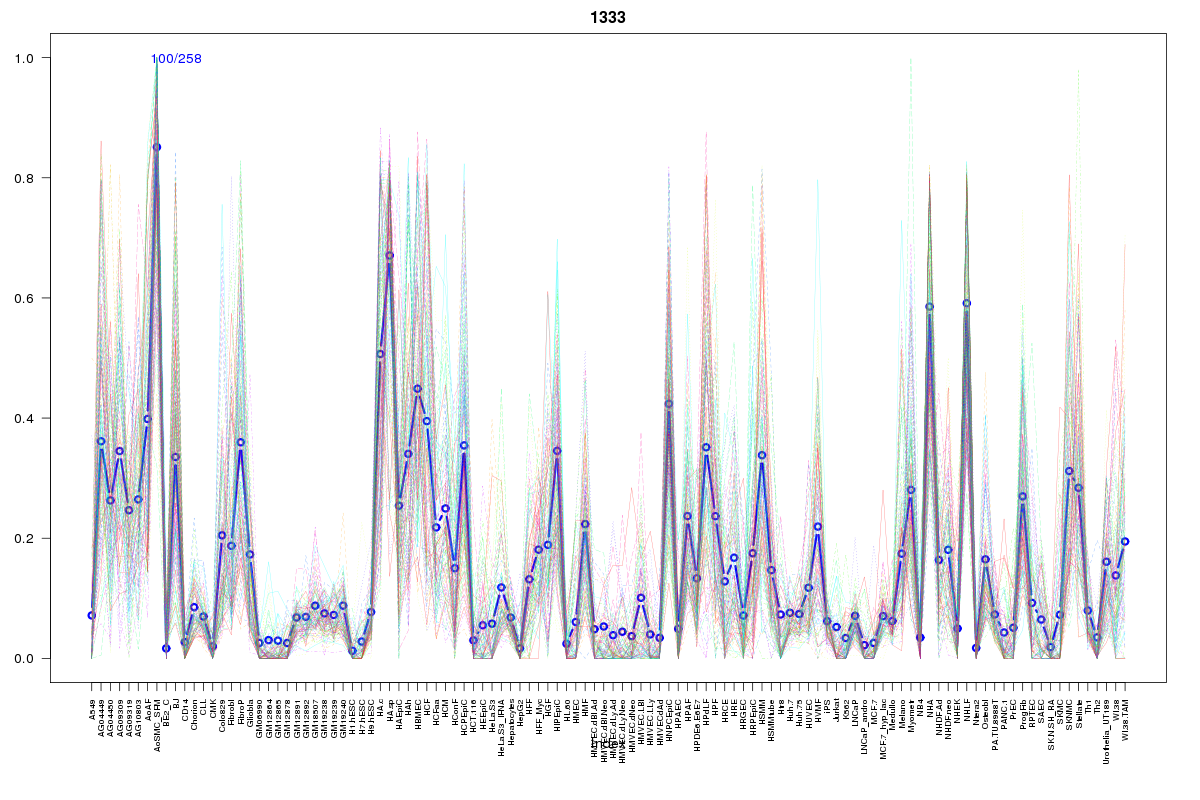
Cluster Hypersensitivity Profile

Genomic Location Trend
These plots show the distribution of the DHS sites surrounding the Transcript Start Site of the nearest gene.
Stats
Number of sites: 258Promoter: 0%
CpG-Island: 0%
Conserved: 50%
Enriched Motifs & Matches
Match Detail: [Jaspar]
|
| ||
|---|---|---|
| Sites: 47/100 | e-val: 0.00000001 | ||
| Factor | e-val(match) | DB |
| Evi1 | 0.0011095 | JASPAR |
| FOXF2 | 0.0023274 | JASPAR |
| NFATC2 | 0.0030668 | JASPAR |
| Foxd3 | 0.003992 | JASPAR |
| MEF2A | 0.0040912 | JASPAR |
|
| ||
| Sites: 31/100 | e-val: 0.12 | ||
| Factor | e-val(match) | DB |
| MEF2A | 0.0015183 | JASPAR |
| Lhx3 | 0.0018725 | JASPAR |
| Foxq1 | 0.0070304 | JASPAR |
| NKX3-1 | 0.0078184 | JASPAR |
| Prrx2 | 0.0094397 | JASPAR |
BED file downloads
Top 10 Example Regions
| Location | Gene Link | Dist. |
|---|---|---|
| chr2: 53951800-53951950 | ERLEC1 | 45.61 |
| chr2: 53951800-53951950 | CHAC2 | 45.61 |
| chr4: 102739660-102739810 | BANK1 | 55.11 |
| chr1: 67856200-67856350 | IL12RB2 | 56.65 |
| chr1: 67856200-67856350 | SERBP1 | 56.65 |
| chr5: 119852700-119852850 | PRR16 | 62.41 |
| chr1: 218543400-218543550 | TGFB2 | 67.31 |
| chr9: 112866600-112866750 | AKAP2 | 67.33 |
| chr6: 149414880-149415030 | UST | 70.3 |
| chr6: 149414880-149415030 | RP11-365H23.1 | 70.3 |