SOM cluster: 1337
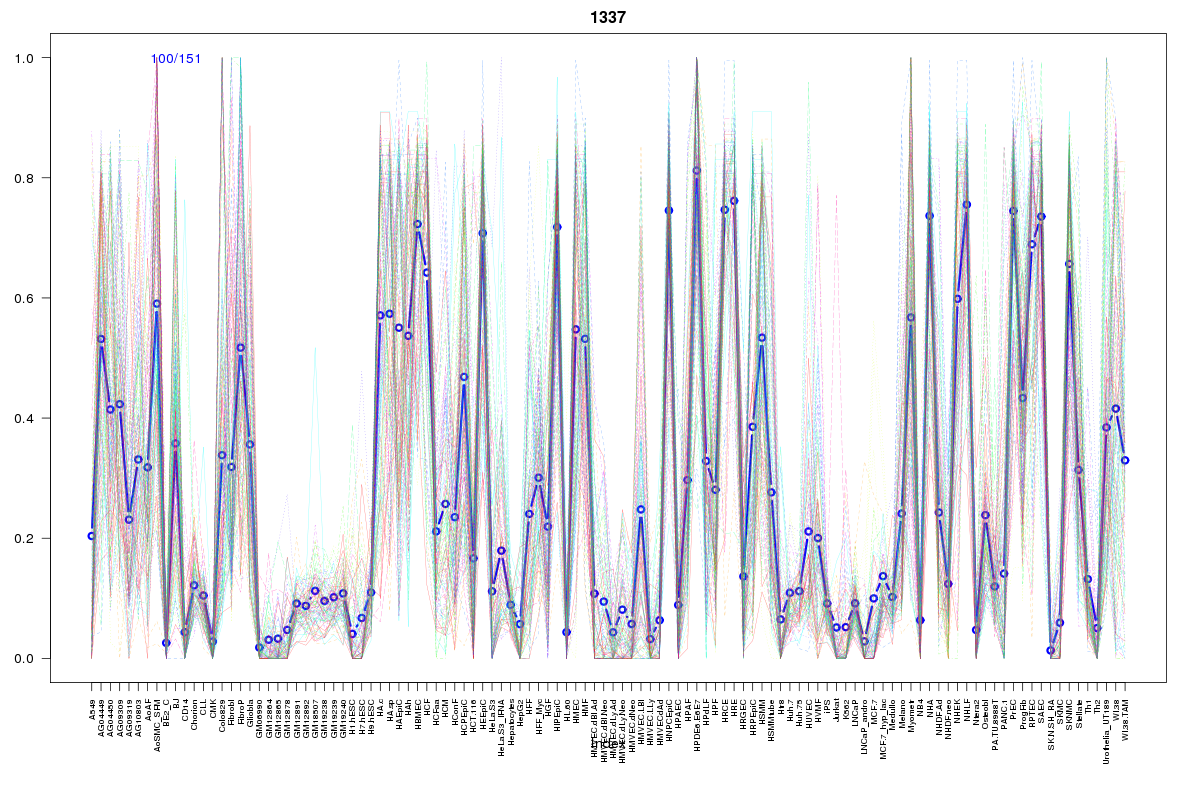
Cluster Hypersensitivity Profile

Genomic Location Trend
These plots show the distribution of the DHS sites surrounding the Transcript Start Site of the nearest gene.
Stats
Number of sites: 151Promoter: 0%
CpG-Island: 0%
Conserved: 41%
Enriched Motifs & Matches
Match Detail: [Jaspar]
|
| ||
|---|---|---|
| Sites: 63/100 | e-val: 2.2e-29 | ||
| Factor | e-val(match) | DB |
| NFE2L2 | 0.00000010154 | JASPAR |
| AP1 | 0.00000010285 | JASPAR |
| NFE2L1::MafG | 0.0043301 | JASPAR |
| PPARG | 0.0069306 | JASPAR |
| HOXA5 | 0.0076413 | JASPAR |
BED file downloads
Top 10 Example Regions
| Location | Gene Link | Dist. |
|---|---|---|
| chr7: 133537860-133538010 | EXOC4 | 38.62 |
| chr1: 183167680-183167830 | LAMC1 | 47.32 |
| chr1: 183167680-183167830 | RP11-548N1.1 | 47.32 |
| chr1: 183167680-183167830 | LAMC2 | 47.32 |
| chr11: 15815000-15815150 | RP11-396O20.2 | 51.82 |
| chr8: 91782620-91782770 | NECAB1 | 56.78 |
| chr8: 91782620-91782770 | RP11-662G23.1 | 56.78 |
| chr18: 25694560-25694710 | CDH2 | 56.84 |
| chr3: 53143340-53143490 | RFT1 | 58.91 |
| chr3: 190100020-190100170 | CLDN1 | 60.48 |